-
Suggested reading: Chapter 2.6, 3.3, 6.1, 6.2, 6.3 and 6.4
Overview of Project Management Process Groups: Planning
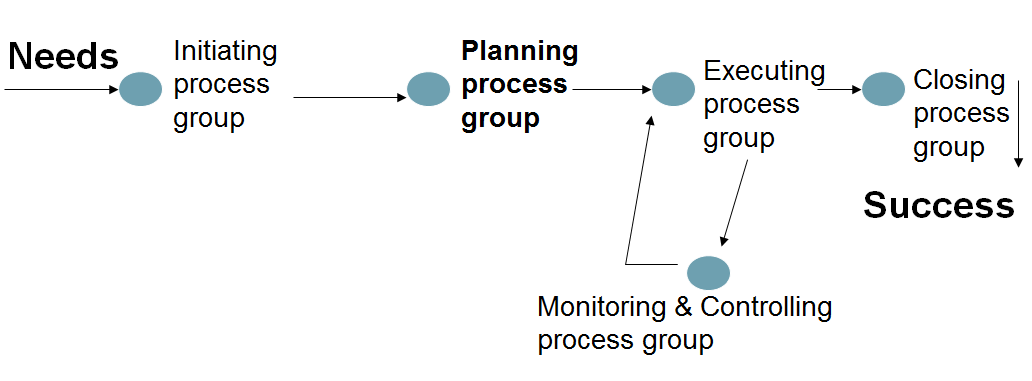
Project Management Process Groups
- 1. Initiating process group
- 2. Planning process group
- 3. Executing process group
- 4. Monitoring & Controlling process group
- 5. Closing process group
Relationships Among Process Groups and Knowledge Areas
Knowledge Area Project Management Process Groups Initiating Planning Executing Monitoring & Controlling Closing Project Integration Management Develop project charter, Develop preliminary project scope statement Develop project management plan Direct and manage project execution Monitor and control project work, Integrated change control Close project Project Scope Management Scope planning, scope definition, Create WBS Scope verification, Scope control Project Time Management Activity definition, Activity sequencing, Activity resource estimating, Activity duration estimating, Schedule development Schedule control Project Cost Management Cost estimating, Cost budgeting Cost control Project Quality Management Quality Planning Perform quality assurance Perform quality control Project Human Resource Management Human resource planning Acquire project team, Develop project team Manage project team Project Communications Management Communications planning Information distribution Performance reporting, Manage stakeholders Project Risk Management Risk management planning, Risk identification, Qualitative risk analysis, Quantative risk analysis, Risk response planning Risk monitoring and control Project Procurement Management Plan purchases and acquisitions, Plan contracting Request seller responses, Select sellers Contract administration Contract closure Planning: Introduction & Overview
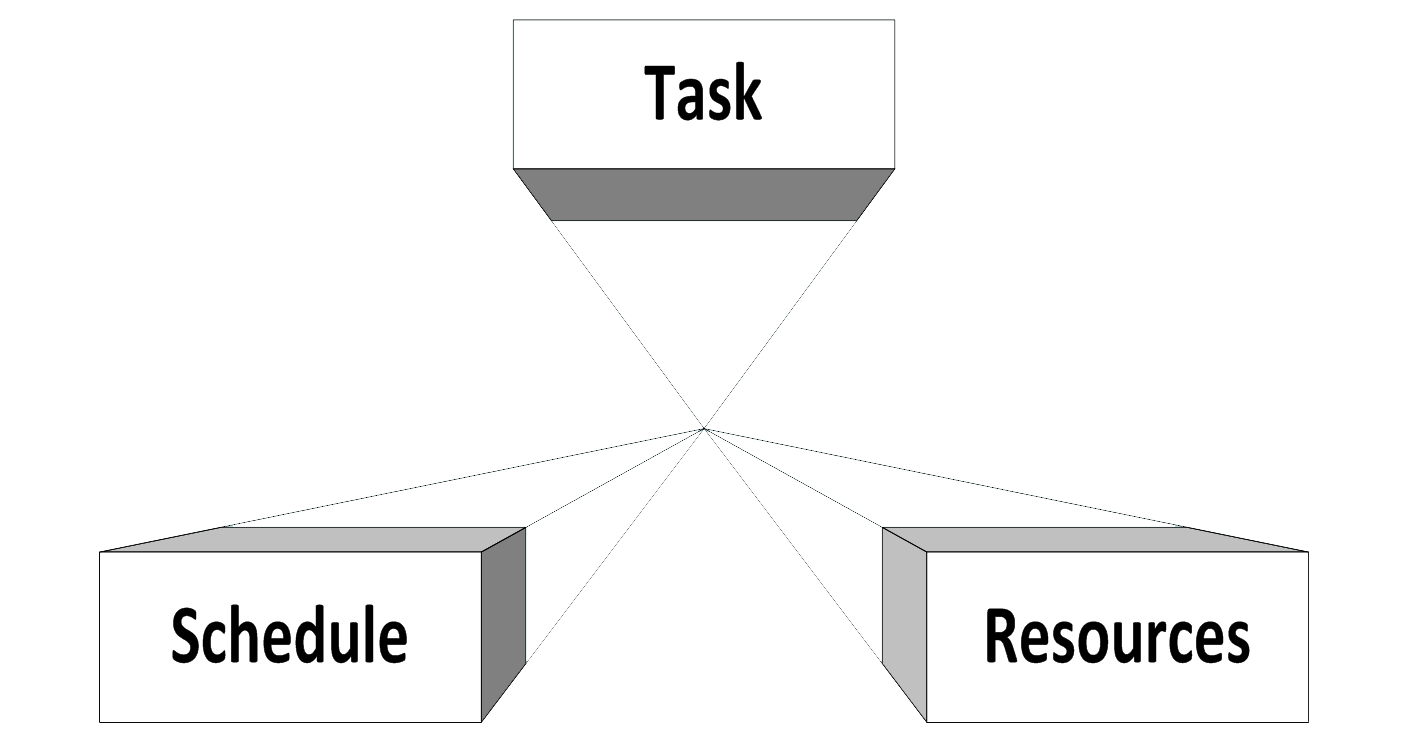
- Determine the work to be done and the tasks to be accomplished
- To satisfy the project requirements
- Determine the schedule for each task and the total project
- Determine the necessary resources for each task and the total project
-
Project Management Tools
- Cost estimation models
- Cost estimation tools
- MS Project
- Work breakdown structure (WBS)
- Activity networks
- Gantt chart
- Workload chart
- Graphs
Contents of a Project Plan: Coursework Overview
- Introduction
- Project Organisation
- Risk Analysis
- Quality management
- Hardware/Software Resource Requirements
- Work Breakdown
- Work Packages Specifications
- includes activities, deliverables
- Project Schedule
- including task dependencies, timings, resource allocation
- Gantt Chart, Activity Network
- Management and Reporting Tools
Project Planning
- How can you plan reasonable estimates?
- You need to find out answers to the key questions
- You must or else you won’t be able to make a reasonable plan!
- The key is software scope and then decomposition of functionality
- Identify basic scope/requirements with the customer, prior to development of plan.
- Very much a feasibility exercise
- Identify the basic configuration (hardware and software functionality)
- Decompose each major aspect of functionality
- size, complexity, interface, performance constraints, resources
- Separate the certain from the uncertain!
- Don’t leave the uncertain until last!
Scope Definition
- Is accomplished by conducting a requirements discovery and analysis exercise, the use of subject matter experts, and a stakeholder analysis
- Requirements Discovery
- Interviews
- History documents
- Research
- PIECES (Performance, Information, Economics, Control, Efficiency, Service)
- Other means e.g. survey, observe, focus group & collect doc.
Work Breakdown Structure (WBS)
- After completing scope planning, the next step is to further define the work by breaking it into manageable pieces “Systems Analysis”
- Good scope definition:
- helps improve the accuracy of time, cost, and resource estimates
- defines a baseline for performance measurement and project control
- aids in communicating clear work responsibilities
What Is Project Scope Management?
- Scope - refers to all (100%) the work involved in creating the products of the project and the processes used to create them
- A Deliverable - is a product produced as part of a project, such as hardware or software, planning documents, or meeting minutes
- Project scope management includes the processes involved in defining and controlling what is or is not included in a project.
-
Project Planning
- Resource definition
- Description, availability, start/end time required
- Resources often take longer to “acquire”/utilise than one thinks!
- Don’t leave “until nearer the time”
Project Activity Planning
- Purpose of Activity Planning is to create a project schedule
- Take the decomposition of the individual project tasks
- produce the timing and sequence of the activities, e.g. WBS, WPS, Activity Network and Gantt Chart
Project Planning
- Project scheduling co-ordinates parallel activities
- trying to utilise the workforce optimally
- objective is to ensure project is not delayed because of a critical task
- decomposing tasks into an appropriate size is key in project scheduling
- A detailed Project Schedule will include several charts
Project Activity Planning
- First Stage is a decomposition of activities
- Work Breakdown Structure (WBS)
- As diagram (or Indented list)
- A WBS is a task decomposition not a sequence diagram
- Task hierarchy is by task function/type not timing
- Then for each task activity, develop an individual Work Package Specification (WPS)
WBS Uses Throughout the Project
- Guide the work of the entire project team
- Facilitate communication
- Aid the team in building the schedule and budget
- Assigning the right person to the right task
- Getting the project to a done state
- Aid in quality control
- Accountability
- Reduce scope creep
- Aid in budget and schedule progress reporting and performance reporting
- Aid in examining alternative steps in building a product
One of the best project management toolsApproaches to Developing WBSs
- Using guidelines: some organizations provide guidelines for preparing WBSs
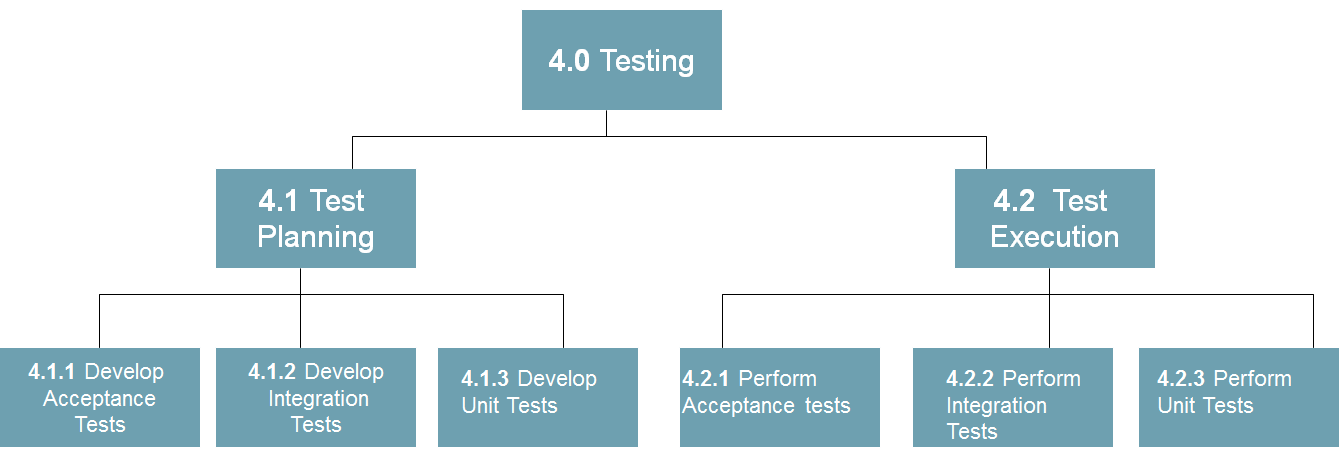
- The top-down approach: start with the largest items of the project and break them down
- The analogy/parallel approach: review WBSs of similar projects and tailor to your project
Work Breakdown Structure Example
-
Work Package Specification
- Activity 1.1
- Name: Analyse Exam Recording Requirements (AN-EX-REC-REQS)
- Description: Perform an analysis of the requirements for the University Exam Recording subsystem of the Student MIS and specify its software requirements.
- Duration: 1 week
- Resources Needed:
- Personnel: Senior Analyst and 1 Junior Analyst
Skill: Analysts familiar with current system & have skill in UML
Tools: Software Architect UML Modelling Tool
Travel: One 3-day system requirements review in San Diego- Work Product: Software Requirements specification for AN-EX-REC_REQS
- Risks: Id and availability of appropriate users of current system (Risk Monitor/control)
- Predecessors: None
- Completion Criteria: Reviewed & signed off SRR for system EX-REC by Senior Project manager(Technical) and HOD Exams Office. (quality control)
Software Project Activity Planning
- WPSs (Work Package Specification) analysis includes:
- Completeness,
- Consistency
- Total and Sub Costs, Duration
- Overall personnel resource requirements
- Other resource requirements
- Personnel and other Resource Conflicts
- Risks, individual and aggregated
- The WBS and individual WPSs may be refined during this process
- The next task is to draw up an activity list and develop a detailed project schedule (as an Activity Diagram and Gantt Chart)
Activity Networks
- An activity list is the first stage in developing the detailed project schedule
- A project schedule can be presented in several forms:
- Gantt Chart
- Activity Network
- It is very much the same information in a different form
- Dependencies between tasks are shown
- Analysis of the schedule is all about identifying the critical path
- Any specific path of dependent activities in the project which must not be delayed
- Its construction should be fairly straight forward from the activity list
- A bit of trial and error (if hand drawn)
- For large projects better with a hierarchy of network diagrams
- High and low level decomposition
- Analysing the Activity Network
- Critical Path Method
- The longest path through the network which cannot afford any delay
- Key terms
- Critical Event (has no ‘float’) (no delay)
- Earliest Event Time (EET)
- Latest Event Time (LET)
- Determine EET/LETs and add to the activity network
- Earliest event time -- The earliest possible time that an event can occur
- Calculated by adding the duration of the intervening activity to the preceding event time. (If several activities terminate on an event node, the longest duration activity must be used)
- Latest event time -- The latest possible time that an event can occur
- Calculated by subtracting the duration of the subsequent activity from the subsequent event. (If two or more activities terminate on an event node, the shortest duration activity must be used)
Example
- From the activity list
- Construct an Activity Network
- Add to the activity network the Earliest and Latest Event Times for each event
Activity List
Activity Description Preceding Activity Duration (weeks) A Booking Process Requirements Analysis - 3 B Holiday System Data Modelling - 4 C Management Reporting Specification A 2 D Interface Design A 3 E Database Design and Interfacing B 3 F Code & Test Software D, E 6 G Customer Acceptance Testing F 3 H Site Installation Planning C 4 Steps
- 1. Identify the milestones (go through each entry & label the milestones) – create a milestone for each unique combination of values e.g. A is M1, B is M2 etc.
- 2. Now draw the activity network – remember-
- a) if activity has no preceding activity: starts from the “start” node
- b) if activity does not form any part of a milestone, it goes straight to the “end” node
- 3. For the early times – walk through the diagram from left to right, if there are alternate paths, use the greater value
- 4. For the late times, ‘walk backwards’ through the diagram from right to left, if there are alternate paths, then use the lesser value
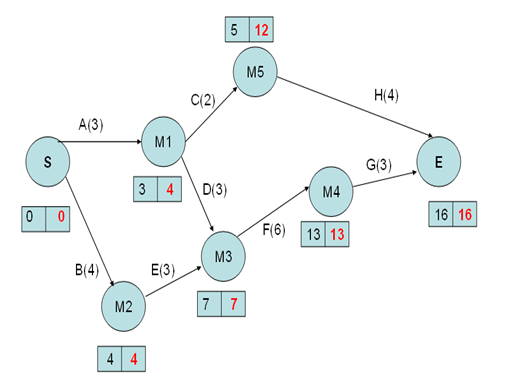
- An activity network is a graphical depiction of an activity list (with early and late times added)
-
Times
- Activities not on the critical path have flexible start times
- The basic analysis of a constructed activity network is via the Critical Path Method (CPM). This essentially involves identifying the longest path through the network.
- This longest path is known as the critical path, since any delays in the events on this path will mean that there is an overall delay in the project schedule and thus the ultimate deadline.
Critical Event
- A Critical Event is defined as an event having identical earliest and latest event times or that has to be completed in the minimum possible time.
Earliest Event Time
- The Earliest Event Time (EET) is the earliest possible time that an event can occur.
- This is calculated by adding the duration of the intervening activity to the preceding event.
- If several activities terminate on an event/milestone node then the longest duration activity is used.
Latest Event Time (LET)
- The Latest Event Time (LET) is the latest possible time that an event can occur.
- This is calculated by subtracting the duration of the subsequent activity from the subsequent event.
- If two or more activities terminate on an event node, the shortest duration activity must be used.
Times
- FLOAT
- Total Float – is defined as the amount by which an activity can be delayed if all its preceding activities take place at their earliest possible times and the following activities are allowed to wait until their latest permissible times.
- Analyse the event times
- Fill in the activity and duration columns and complete the table in the following order
- Earliest start (Early value at base of activity arrow for each activity)
- Earliest finish = Earliest start + Duration
- Latest finish (Late value at the head of the activity arrow for each activity)
- Latest start = Latest finish – Duration
- Total float = difference of either of the 2 ‘start’ or 2 ‘finish’ columns
- Critical Path – activity path(s) where total float is zero
- Or by looking at diagram – it is through the nodes with equal earliest and latest start times – use this as a double check
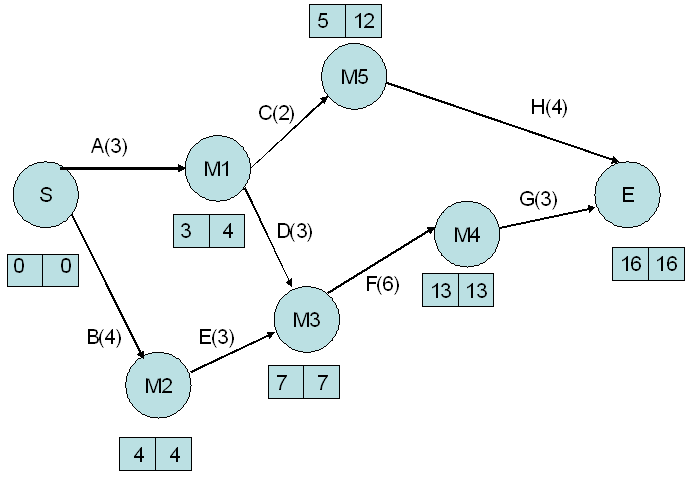
Activity Duration Earliest
StartEarliest
FinishLatest
StartLatest
FinishTotal
FloatA 3 0 4 B 4 0 4 C 2 3 12 D 3 3 7 E 3 4 7 F 6 7 13 G 3 13 16 H 4 5 16
- Earliest Finish =Earliest Start (ES) + Duration
Tip: longest durationActivity Duration Earliest
StartEarliest
FinishLatest
StartLatest
FinishTotal
FloatA 3 0 3 4 B 4 0 4 4 C 2 3 5 12 D 3 3 6 7 E 3 4 7 7 F 6 7 13 13 G 3 13 16 16 H 4 5 9 16
- Latest start (LS)= Latest Finish (LF) - Duration
Tip: shortest durationActivity Duration Earliest
StartEarliest
FinishLatest
StartLatest
FinishTotal
FloatA 3 0 3 1 4 B 4 0 4 0 4 C 2 3 5 10 12 D 3 3 6 4 7 E 3 4 7 4 7 F 6 7 13 7 13 G 3 13 16 13 16 H 4 5 9 12 16
- Total float= Latest Start – Earliest Start
Or
Total Float= Latest Finish-Earliest FinishActivity Duration Earliest
StartEarliest
FinishLatest
StartLatest
FinishTotal
FloatA 3 0 3 1 4 1 B 4 0 4 0 4 0 C 2 3 5 10 12 7 D 3 3 6 4 7 1 E 3 4 7 4 7 0 F 6 7 13 7 13 0 G 3 13 16 13 16 0 H 4 5 9 12 16 7 Activity Duration Earliest
StartEarliest
FinishLatest
StartLatest
FinishTotal
FloatA 3 0 3 1 4 1 B 4 0 4 0 4 0 C 2 3 5 10 12 7 D 3 3 6 4 7 1 E 3 4 7 4 7 0 F 6 7 13 7 13 0 G 3 13 16 13 16 0 H 4 5 9 12 16 7 - Critical Path is: B -> E -> F -> G
- Total Float is defined as
the amount by which an activity can be delayed if all its preceding activities take place at their earliest possible times and the following activities are allowed to wait until their latest permissible times.- If total float is 0, that means the activity can not be delayed.
Critical Event
- A Critical Event is defined as
- an event having identical earliest and latest event times or that has to be completed in the minimum possible time.
-
Past exam paper
- The project manager in charge of a project is at the stage of having developed the outline task decomposition
- for the project and wishes to do some initial project scheduling. This task decomposition is represented in the following activity list table
Activity Description Preceding Activity Duration (weeks) A Booking Process Requirements Analysis - 3 B Holiday System Data Modelling - 4 C Management Reporting Specification A 2 D Interface Design A 3 E Database Design and Interfacing B 3 F Code & Test Software D, E 6 G Customer Acceptance Testing F 3 H Site Installation Planning C 4 - i) Construct an activity network [5]
- ii) Add to the activity network the Earliest and Latest Event Times for each event [3]
- iii) Construct a table that provides an analysis of the event times, and the project float. Also identify the Critical Path in this project. [5]
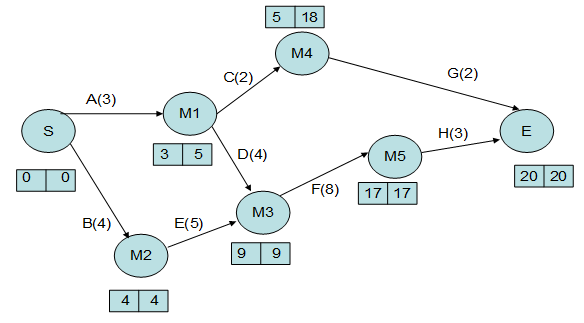
Float Table
Activity Duration Earliest
StartEarliest
FinishLatest
StartLatest
FinishTotal
FloatA 3 0 3 2 5 2 B 4 0 4 0 4 0 C 2 3 5 16 18 13 D 4 3 7 5 9 2 E 5 4 9 4 9 0 F 8 9 17 9 17 0 G 2 5 7 18 20 13 H 3 17 20 17 20 0 -
Activity network
Content
- Describe how project managers use network diagrams to assist in activity sequencing
- Understand the relationship between estimating resources and project schedules
- Use a Gantt chart for planning and tracking schedule information
Project Time Management Processes
- Activity definition: identifying the specific activities that the project team members and stakeholders must perform to produce the project deliverables
- Activity sequencing: identifying and documenting the relationships between project activities
- Activity resource estimating: estimating how many resources a project team should use to perform project activities
Importance of Project Schedules
- Managers often cite delivering projects on time as one of their biggest challenges
- Time has the least amount of flexibility; it passes no matter what happens on a project
- Schedule issues are the main reason for conflicts on projects, especially during the second half of projects
Project Time Management Processes
- Activity duration estimating: estimating the number of work periods that are needed to complete individual activities
- Schedule development: analysing activity sequences, activity resource estimates, and activity duration estimates to create the project schedule
- Schedule control: controlling and managing changes to the project schedule
Activity Definition
- Project schedules grow out of the basic documents that initiate a project
- Project charter includes start and end dates and budget information
- Scope statement and WBS help define what will be done
- Activity definition involves developing a more detailed WBS and supporting explanations to understand all the work to be done so you can develop realistic cost and duration estimates
Milestones
- A milestone is a significant event that normally has no duration
- It often takes several activities and a lot of work to complete a milestone
- They’re useful tools for
- setting schedule goals and,
- monitoring progress
- Examples include
- obtaining customer sign-off on key documents or
- completion of specific products
Using the Critical Path to Shorten a Project Schedule
- Three main techniques for shortening schedules
- Shortening durations of critical activities/tasks by adding more resources or changing their scope
- Crashing activities by obtaining the greatest amount of schedule compression for the least incremental cost
- Fast tracking activities by doing them in parallel or overlapping them
Importance of Updating Critical Path Data
- It is important to update project schedule information to meet time goals for a project
- The critical path may change as you enter actual start and finish dates
- If you know the project completion date will slip, negotiate with the project sponsor
-
Critical Chain Scheduling
- A method of scheduling that considers limited resources when creating a project schedule and includes buffers to protect the project completion date
Summary of Scheduling Techniques for Software Projects
- The project schedule specifies time‑ sequencing dependencies among work activities and indicates opportunities for concurrent work activities
- Techniques for schedule planning include
- Activity Lists: can be generated from work package specs
- Activity Networks: graphical illustrations of activity lists
- Critical Path Networks: critical time dependencies and slack times
- Gantt Charts: illustrates activity duration and start and stop times
Schedule Control
- Perform reality checks on schedules
- Allow for contingencies
- Don’t plan for everyone to work at 100% capacity all the time
- Hold progress meetings with stakeholders and be clear and honest in communicating schedule issues
- Goals are to:
- know the status of the schedule,
- influence factors that cause schedule changes,
- determine that the schedule has changed,
- and manage changes when they occur
- Tools and techniques include:
- Progress reports
- A schedule change control system
- Project management software, including schedule comparison charts like the tracking Gantt chart
- Performance management, such as earned value
Reality Checks on Scheduling
- First review the draft schedule or estimated completion date in the project charter
- Prepare a more detailed schedule with the project team
- Make sure the schedule is realistic and followed
- Alert top management well in advance if there are schedule problems
Using Software to Assist in Time Management
- Software for facilitating communications helps people exchange schedule-related information
- Decision support models help analyze trade-offs that can be made
- Project management software can help in various time management areas
- You must enter actual schedule information to compare planned and actual progress
(a) Discuss the purpose and importance of a work breakdown structure (WBS) in project management.
- A WBS is a deliverable oriented grouping of the work involved in a project that defines the total scope of the project. Because most projects involve many people and many different deliverables, it is important to organise and divide the work into logical parts based on how the work will be performed. The WBS is a foundation document in project management - it provides the basis for planning and managing project schedules, costs, resources and changes. Can be shown as a task oriented family tree of activities, similar to an organisation chart, or shown in tabular form as an indented list of tasks. Shown in Gantt charts in MS Project.
-
Quick Quiz
- 1. Which step in project time management sounds like it belongs under scope management?
- Reveal Answer
- ANSWER: Defining activities
- 2. What is the most common type of task dependency?
- Reveal Answer
- ANSWER: Finish-to-start.
- 3. What is the critical path on a project?
- Reveal Answer
- ANSWER: The critical path is the series of activities in a project network diagram that determines the earliest completion date of the project. See other definitions in the text.
-
Key Terms
- Activity attributes: Information about each activity, such as predecessors, successors, logical relationships, leads and lags, resource requirements, constraints, imposed dates, and assumptions related to the activity
- Activity list: A tabulation of activities to be included on a project schedule
- Activity: An element of work normally found on the WBS that has an expected duration, cost, and resource requirements; also called a task
- Activity-on-arrow (AOA): A network diagramming technique in which activities are represented by arrows and connected at points called nodes to illustrate the sequence of activities; also called arrow diagramming method (ADM)
- Arrow diagramming method (ADM): A network diagramming technique in which activities are represented by arrows and connected at points called nodes to illustrate the sequence of activities; also called activity-on-arrow (AOA)
- Critical chain scheduling: A method of scheduling that takes limited resources into account when creating a project schedule and includes buffers to protect the project completion date
- Critical path method (CPM) or critical path analysis: A project network diagramming technique used to predict total project duration
- Critical path: The series of activities in a network diagram that determines the earliest completion of the project; it is the longest path through the network diagram and has the least amount of slack or float
- Dependency: The sequencing of project activities or tasks; also called a relationship
- Discretionary dependencies: The sequencing of project activities or tasks defined by the project team and used with care because they may limit later scheduling options
- Dummy activities: Activities are with no duration and no resources used to show a logical relationship between two activities in the arrow diagramming method of project network diagrams
- Duration: The actual amount of time worked on an activity plus elapsed time
- Early finish date: The earliest possible time an activity can finish based on the project network logic
- Early start date: The earliest possible time an activity can start based on the project network logic
- Effort: The number of workdays or work hours required to complete a task
- External dependencies: The sequencing of project activities or tasks that involve relationships between project and non-project activities
- Fast tracking: A schedule compression technique in which you do activities in parallel that you would normally do in sequence
- Feeding buffers: Time added before tasks on the critical chain if they are preceded by other tasks that are not on the critical path
- Rational Unified Process (RUP) framework: An iterative software development process that focuses on team productivity and delivers software best practices to all team members
- Scrum team or development team: A cross-functional team of five to nine people who organize themselves and the work to produce the desired results for each sprint
- Scrum Master: A person who ensures that the team is productive, facilitates the daily Scrum, enables close cooperation across all roles and functions, and removes barriers that prevent the team from being effective
- Six Sigma methodologies: DMAIC (Define, Measure, Analyse, Improve, and Control) is used to improve an existing business process, and DMADV (Define, Measure, Analyse, Design, and Verify) is used to create new product or process designs
- Sprint backlog: The highest-priority items from the product backlog to be completed in a sprint