-
Learning Objectives
- Understand the importance of project quality management for information technology (IT) products and services
- Define project quality management and understand how quality relates to various aspects of IT projects
- Describe quality management planning and how quality and scope management are related
- Discuss the importance of quality assurance
- Explain the main outputs of the quality control process
- Understand the tools and techniques for quality control, such as the Seven Basic Tools of Quality, statistical sampling, Six Sigma, and testing
- Summarise the contributions of noteworthy quality experts to modern quality management
- Describe how leadership, the cost of quality, organisational influences, expectations, cultural differences, and maturity models relate to improving quality in IT projects
- Discuss how software can assist in project quality management
Suggested reading: chapter 8
The Importance of Project Quality Management
- Many people joke about the poor quality of IT products
- People seem to accept systems being down occasionally or needing to reboot their PCs
- But quality is very important in many IT projects
What Went Wrong?
- In 1986, two hospital patients died after receiving fatal doses of radiation from a Therac 25 machine after a software problem caused the machine to ignore adjustment data
- In one of the biggest software errors in banking history, Chemical Bank mistakenly deducted about $15 million from more than 100,000 customer accounts
- In 2015, the United States Department of Justice unsealed charges in what was described as “the largest data break of names and e-mail addresses in the history of the internet”
What Is Project Quality?
- The International Organisation for Standardisation (ISO) defines quality as “the degree to which a set of inherent characteristics fulfils requirements” (ISO9000:2000)
- Other experts define quality based on:
- Conformance to requirements: The project’s processes and products meet written specifications
- Fitness for use: A product can be used as it was intended
What Is Project Quality Management?
- Project quality management ensures that the project will satisfy the needs for which it was undertaken
- Processes include:
- Planning quality management: Identifying which quality standards are relevant to the project and how to satisfy them; a metric is a standard of measurement
- Performing quality assurance: Periodically evaluating overall project performance to ensure the project will satisfy the relevant quality standards
- Performing quality control: Monitoring specific project results to ensure that they comply with the relevant quality standards
Planning Quality
- Implies the ability to anticipate situations and prepare actions to bring about the desired outcome
- Important to prevent defects by:
- Selecting proper materials
- Training and indoctrinating people in quality
- Planning a process that ensures the appropriate outcome
Scope Aspects of IT Projects
- Functionality is the degree to which a system performs its intended function
- Features are the system’s special characteristics that appeal to users
- System outputs are the screens and reports the system generates
- Performance addresses how well a product or service performs the customer’s intended use
- Reliability is the ability of a product or service to perform as expected under normal conditions
- Maintainability addresses the ease of performing maintenance on a product
Discover ambiguities or omissions in the following statement of requirements for part of a ticket-issuing system:
- An automated ticket-issuing system sells rail tickets. Users select their destination and input a credit card and a personal identification number. The rail ticket is issued and their credit card account charged. When the user presses the start button, a menu display of potential destinations is activated, along with a message to the user to select a destination. Once a destination has been selected, users are requested to input their credit card. Its validity is checked and the user is then requested to input a personal identifier. When the credit transaction has been validated, the ticket is issued.
Write a set of non-functional requirements for the ticket-issuing system, setting out its expected reliability and response time
- Possible non-functional requirements for the ticket issuing system include:
- 1. Between 0600 and 2300 in any one day, the total system down time should not exceed 5 minutes.
- 2. Between 0600 and 2300 in any one day, the recovery time after a system failure should not exceed 2 minutes.
- 3. Between 2300 and 0600 in any one day, the total system down time should not exceed 20 minutes. All these are availability requirements – note that these vary according to the time of day. Failures when most people are traveling are less acceptable than failures when there are few customers.
- 4. After the customer presses a button on the machine, the display should be updated within 0.5 seconds.
- 5. The ticket issuing time after credit card validation has been received should not exceed 10 seconds.
- 6. When validating credit cards, the display should provide a status message for customers indicating that activity is taking place. This tells the customer that the potentially time consuming activity of validation is still in progress and that the system has not simply failed.
- 7. The maximum acceptable failure rate for ticket issue requests is 1: 10000.
-
Who’s Responsible for the Quality of Projects?
- Project managers are ultimately responsible for quality management on their projects
- Several organisations and references can help project managers and their teams understand quality
- International Organisation for Standardisation (www.iso.org)
- IEEE (www.ieee.org)
Performing Quality Assurance
- Quality assurance includes all the activities related to satisfying the relevant quality standards for a project
- Another goal of quality assurance is continuous quality improvement. Kaizen is the Japanese word for improvement or change for the better
- Lean involves evaluating processes to maximise customer value while minimising waste
- Benchmarking generates ideas for quality improvements by comparing specific project practices or product characteristics to those of other projects or products within or outside the performing organisation
- A quality audit is a structured review of specific quality management activities that help identify lessons learned that could improve performance on current or future projects
What Went Right?
- Kanban uses five core properties
- Visual workflow
- Limit work-in-process
- Measure and manage flow
- Make process policies explicit
- Use models to recognise improvement opportunities
- The application of Kanban is different for every team
Controlling Quality
- The main outputs of quality control are:
- Acceptance decisions
- Rework
- Process adjustments
- There are some Basic Tools of Quality that help in performing quality control
Cause-and-Effect Diagrams
- Cause-and-effect diagrams trace complaints about quality problems back to the responsible production operations
- They help you find the root cause of a problem
- Also known as fishbone or Ishikawa diagrams
- Can also use the 5 whys technique where you repeated ask the question “Why” (five is a good rule of thumb) to peel away the layers of symptoms that can lead to the root cause
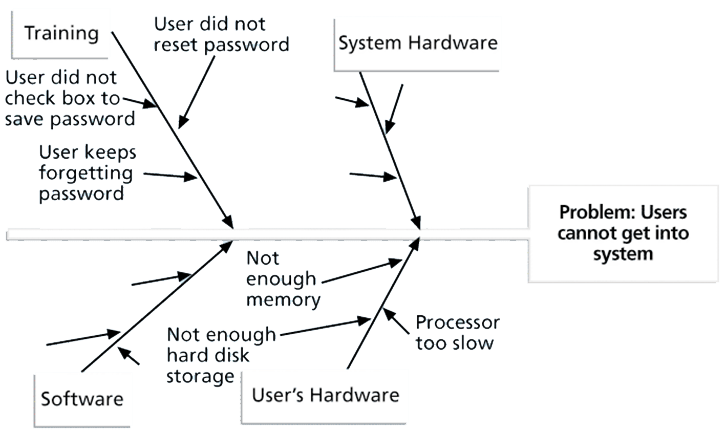
- Figure 8-2. Sample Cause-and-Effect Diagram
-
Quality Control Charts
- A control chart is a graphic display of data that illustrates the results of a process over time
- The main use of control charts is to prevent defects, rather than to detect or reject them
- Quality control charts allow you to determine whether a process is in control or out of control
- When a process is in control, any variations in the results of the process are created by random events; processes that are in control do not need to be adjusted
- When a process is out of control, variations in the results of the process are caused by non-random events; you need to identify the causes of those non-random events and adjust the process to correct or eliminate them
Checksheet
- A checksheet is used to collect and analyse data
- It is sometimes called a tally sheet or checklist, depending on its format
- In the example in Figure 8-4, most complaints arrive via text message, and there are more complaints on Monday and Tuesday than on other days of the week
- This information might be useful in improving the process for handling complaints
Day Source Monday Tuesday Wednesday Thursday Friday Saturday Sunday Total Email III IIII I II I I 12 Text IIIII II IIII IIIII I III IIII II III 29 Phone call I II I I II I 8 Total 11 10 8 6 7 3 4 49 Scatter diagram
- A scatter diagram helps to show if there is a relationship between two variables
- The closer data points are to a diagonal line, the more closely the two variables are related
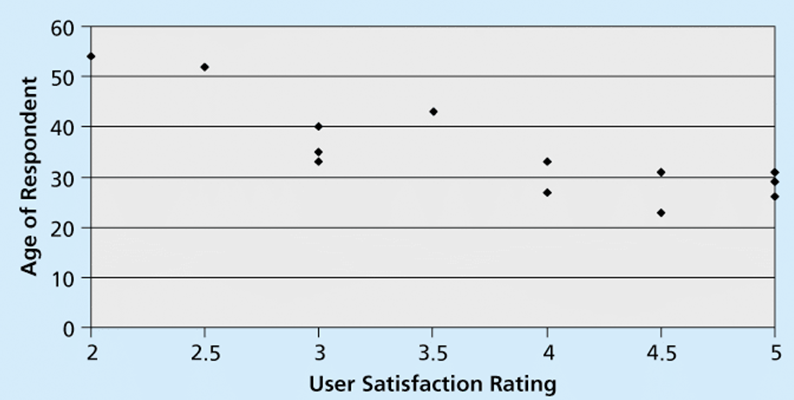
- Figure 8-5. Sample Scatter Diagram
Histograms
- A histogram is a bar graph of a distribution of variables
- Each bar represents an attribute or characteristic of a problem or situation, and the height of the bar represents its frequency
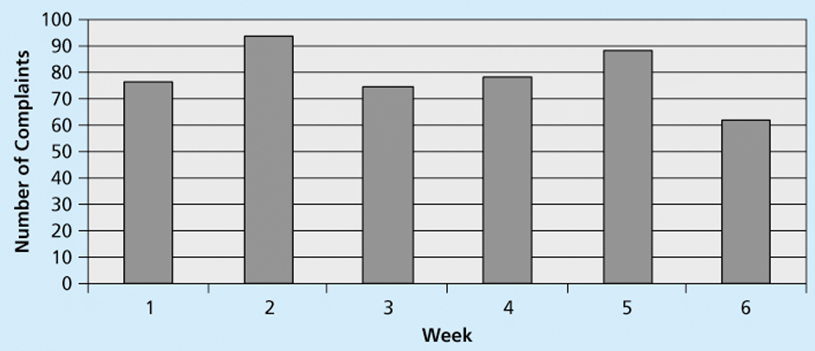
- Figure 8-6. Sample Histogram
Flowcharts
- Flowcharts are graphic displays of the logic and flow of processes that help you analyze how problems occur and how processes can be improved
- They show activities, decision points, and the order of how information is processed
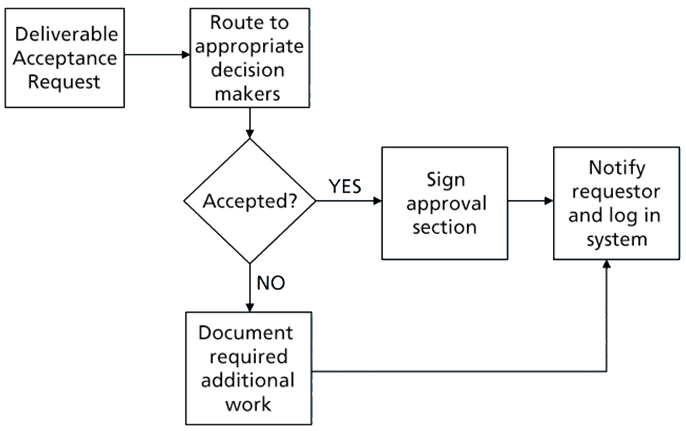
- Figure 8-8. Sample Flowchart
Run Charts
- In addition to flowcharts, run charts are also used for stratification, a technique that shows data from a variety of sources to see if a pattern emerges
- A run chart displays the history and pattern of variation of a process over time.
- You can use run charts to perform trend analysis and forecast future outcomes based on historical results
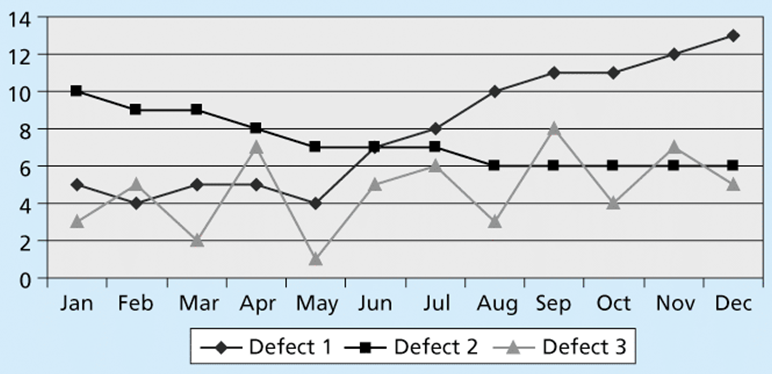
- Figure 8-9. Sample Run Chart
Statistical Sampling
- Statistical sampling involves choosing part of a population of interest for inspection
- The size of a sample depends on how representative you want the sample to be
- Sample size formula:
Sample size = .25 X (certainty factor/acceptable error)2- Be sure to consult with an expert when using statistical analysis
Desired Certainty Certainty Factor 95% 1.960 90% 1.645 80% 1.281 - Table 8-1. Commonly Used Certainty Factors
-
Six Sigma
- Six Sigma is “a comprehensive and flexible system for achieving, sustaining, and maximising business success. Six Sigma is uniquely driven by close understanding of customer needs, disciplined use of facts, data, and statistical analysis, and diligent attention to managing, improving, and reinventing business processes”*
- *Pande, Peter S., Robert P. Neuman, and Roland R. Cavanagh, The Six Sigma Way, New York: McGraw-Hill, 2000, p. xi.
Basic Information on Six Sigma
- The target for perfection is the achievement of no more than 3.4 defects per million opportunities
- The principles can apply to a wide variety of processes
Six Sigma projects normally follow a five-phase improvement process called DMAIC
- DMAIC is a systematic, closed-loop process for continued improvement that is scientific and fact based
- DMAIC stands for:
- Define: Define the problem/opportunity, process, and customer requirements|
- Measure: Define measures, then collect, compile, and display data
- Analyse: Scrutinise process details to find improvement opportunities
- Improve: Generate solutions and ideas for improving the problem
- Control: Track and verify the stability of the improvements and the predictability of the solution
How is Six Sigma Quality Control Unique?
- It requires an organization-wide commitment.
- Training follows the “Belt” system
- Six Sigma organizations have the ability and willingness to adopt contrary objectives, such as reducing errors and getting things done faster
- It is an operating philosophy that is customer focused and strives to drive out waste, raise levels of quality, and improve financial performance at breakthrough levels
Six Sigma and Project Management
- Joseph M. Juran stated, “All improvement takes place project by project, and in no other way”*
- It’s important to select projects carefully and apply higher quality where it makes sense; companies that use Six Sigma do not always boost their stock values
- Six Sigma projects must focus on a quality problem or gap between the current and desired performance and not have a clearly understood problem or a predetermined solution
- *“What You Need to Know About Six Sigma,” Productivity Digest (December 2001), p. 38.
Six Sigma Projects Use Project Management
- The training for Six Sigma includes many project management concepts, tools, and techniques
- For example, Six Sigma projects often use business cases, project charters, schedules, budgets, and so on
- Six Sigma projects are done in teams; the project manager is often called the team leader, and the sponsor is called the champion
Six Sigma and Statistics
- The term sigma means standard deviation
- Standard deviation measures how much variation exists in a distribution of data
- Standard deviation is a key factor in determining the acceptable number of defective units found in a population
- Six Sigma projects strive for no more than 3.4 defects per million opportunities, yet this number is confusing to many statisticians
Six Sigma Uses a Conversion Table
- Using a normal curve, if a process is at six sigma, there would be no more than two defective units per billion produced
- Six Sigma uses a scoring system that accounts for time, an important factor in determining process variations
- Yield represents the number of units handled correctly through the process steps
- A defect is any instance where the product or service fails to meet customer requirements
- There can be several opportunities to have a defect
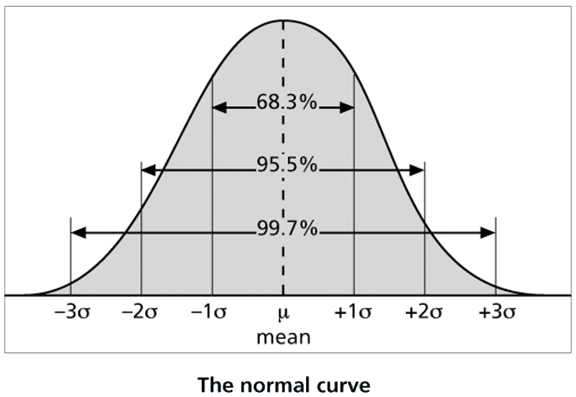
- Figure 8-10. Normal Distribution and Standard Deviation
Specification Range
(in + Sigmas)Precent of Population
within RangeDefective Units
per Billion1 68.27 317,300,000 2 95.45 45,400,000 3 99.73 2,700,000 4 99.9937 63,000 5 99.999943 57 6 99.9999998 2 - Table 8-2. Sigma and Defective Units
Sigma Yield Defects per Million Opportunities (DPMO) 1 31.0% 690,000 2 69.2% 308,000 3 93.3% 66,800 4 99.4% 6,210 5 99.97% 230 6 99.99966% 3.4 - Table 8-3: Sigma Conversion Table
Six 9s of Quality
- Six 9s of quality is a measure of quality control equal to 1 fault in 1 million opportunities
- In the telecommunications industry, it means 99.9999 percent service availability or 30 seconds of down time a year
- This level of quality has also been stated as the target goal for the number of errors in a communications circuit, system failures, or errors in lines of code
-
Testing
- Many IT professionals think of testing as a stage that comes near the end of IT product development
- Testing should be done during almost every phase of the IT product development life cycle
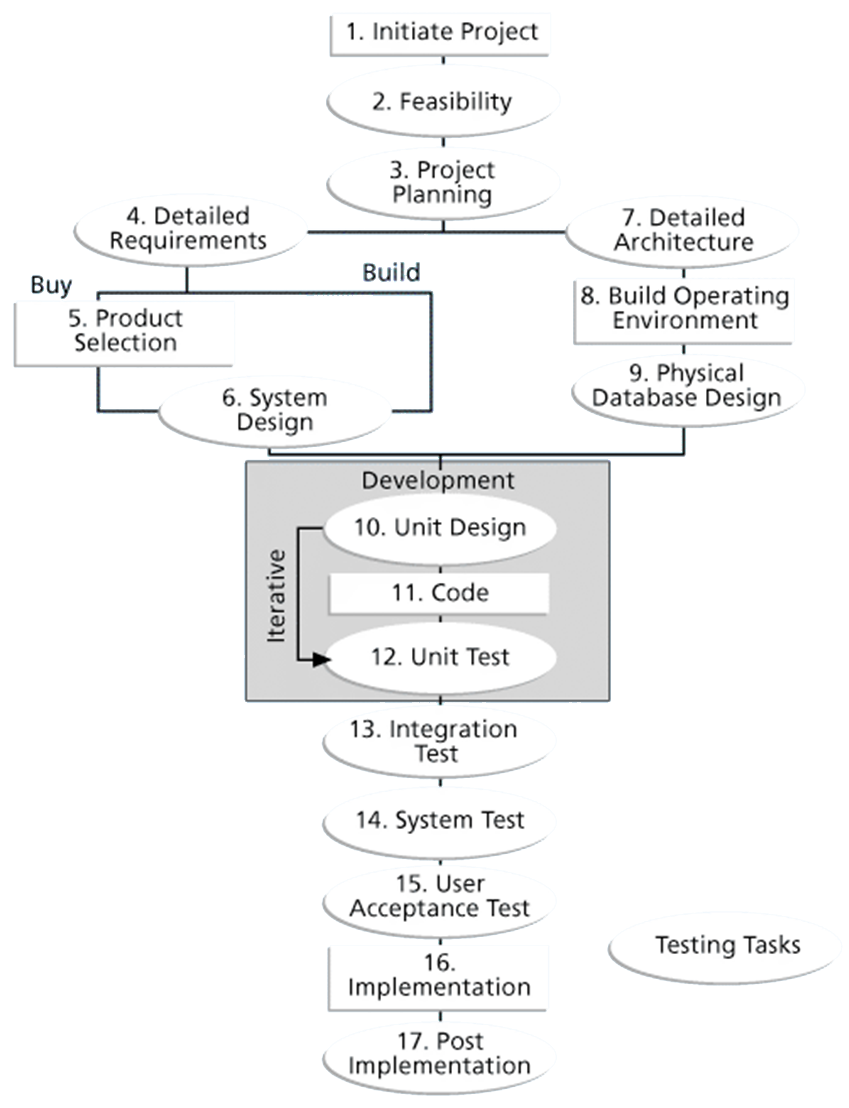
- Figure 8-11. Testing Tasks in the Software Development Life Cycle
Types of Tests
- Unit testing tests each individual component (often a program) to ensure it is as defect-free as possible
- Integration testing occurs between unit and system testing to test functionally grouped components
- System testing tests the entire system as one entity
- User acceptance testing is an independent test performed by end users prior to accepting the delivered system
Testing Alone Is Not Enough
- Watts S. Humphrey, a renowned expert on software quality, defines a software defect as anything that must be changed before delivery of the program
- Testing does not sufficiently prevent software defects because:
- The number of ways to test a complex system is huge
- Users will continue to invent new ways to use a system that its developers never considered
- Humphrey suggests that people rethink the software development process to provide no potential defects when you enter system testing; developers must be responsible for providing error-free code at each stage of testing
-
Modern Quality Management
- Modern quality management:
- Requires customer satisfaction
- Prefers prevention to inspection
- Recognises management responsibility for quality
- Noteworthy quality experts include Deming, Juran, Crosby, Ishikawa, Taguchi, and Feigenbaum
ISO Standards
- ISO 9000 is a quality system standard that:
- Is a three-part, continuous cycle of planning, controlling, and documenting quality in an organisation
- Provides minimum requirements needed for an organization to meet its quality certification standards
- Helps organisations around the world reduce costs and improve customer satisfaction
- See www.iso.org for more information
Global Issues
- In 2015, 15 electric cars were introduced throughout the world
- Driverless cars are also being tested
- Google’s director of self-driving cars is striving to improve their quality to reduce accident rates
Improving Information Technology Project Quality
- Several suggestions for improving quality for IT projects include:
- Establish leadership that promotes quality
- Understand the cost of quality
- Focus on organisational influences and workplace factors that affect quality
- Follow maturity models
Leadership
- As Joseph M. Juran said in 1945, “It is most important that top management be quality-minded. In the absence of sincere manifestation of interest at the top, little will happen below”*
- A large percentage of quality problems are associated with management, not technical issues.
- *American Society for Quality (ASQ), (www.asqc.org/about/history/juran.html).
The Cost of Quality
- The cost of quality is the cost of conformance plus the cost of nonconformance
- Conformance means delivering products that meet requirements and fitness for use
- Cost of nonconformance means taking responsibility for failures or not meeting quality expectations
- A study reported that software bugs cost the U.S. economy $59.6 billion each year and that one third of the bugs could be eliminated by an improved testing infrastructure
Five Cost Categories Related to Quality
- Prevention cost: Cost of planning and executing a project so it is error-free or within an acceptable error range
- Appraisal cost: Cost of evaluating processes and their outputs to ensure quality
- Internal failure cost: Cost incurred to correct an identified defect before the customer receives the product
- External failure cost: Cost that relates to all errors not detected and corrected before delivery to the customer
- Measurement and test equipment costs: Capital cost of equipment used to perform prevention and appraisal activities
Media Snapshot
- Computer viruses and malware software have been a quality concern for years
- In a new twist, consumers are now being warned that e-cigarettes can be bad for computers
- Anything can infect your computer if it can be inserted into a USB port
- Other consumer products like smart TVs can invade on privacy
Organisational Influences, Workplace Factors, and Quality
- Study by DeMarco and Lister showed that organisational issues had a much greater influence on programmer productivity than the technical environment or programming languages
- Programmer productivity varied by a factor of one to ten across organisations, but only by 21 percent within the same organisation
- Study found no correlation between productivity and programming language, years of experience, or salary.
- A dedicated workspace and a quiet work environment were key factors to improving programmer productivity
Expectations and Cultural Differences in Quality
- Project managers must understand and manage stakeholder expectations.
- Expectations also vary by:
- Organisation’s culture
- Geographic regions
-
Maturity Models
- Maturity models are frameworks for helping organisations improve their processes and systems
- The Software Quality Function Deployment Model focuses on defining user requirements and planning software projects
- The Software Engineering Institute’s Capability Maturity Model Integration is a process improvement approach that provides organisations with the essential elements of effective processes
What is CMM
- CMM (Capability Maturity Model)
- It is a method to evaluate and measure the maturity of the software development process of an organisation.
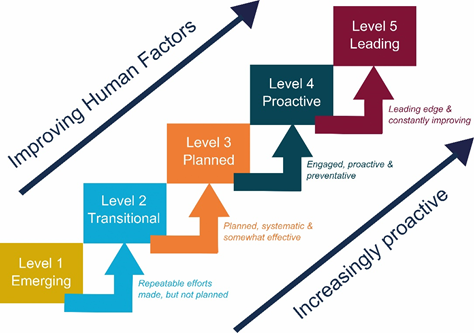
- The maturity of software development process measurement is on a scale of 1 to 5 level
- The Software Engineering Institute (SEI) Capability Maturity Model (CMM) specifies an increasing series of levels of a software development organisation.
- The higher the level, the better the software development process, hence reaching each level is an expensive and time-consuming process.
- (data source: http://www.tutorialspoint.com/software_testing_dictionary/capability_maturity_model.htm)
What is Maturity?
- Level of CMM
- Definitions: well defined; repeatable; measured; analysed; improved and effective
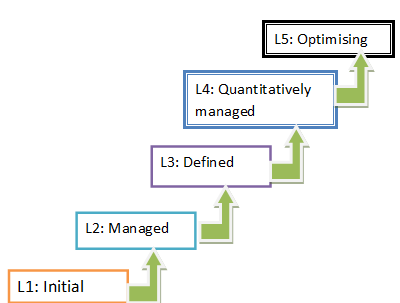
The level 1 of maturity
- CMM has 5 levels of maturity.
- Level One :Initial
- The software process is characterised as inconsistent, and occasionally even chaotic. Defined processes and standard practices that exist are abandoned during a crisis.
- Success of the organisation majorly depends on an individual effort, talent, and heroics.
- The heroes eventually move on to other organisations taking their wealth of knowledge or lessons learnt with them.
The level 2 of maturity
- Level Two: Repeatable
- This level of Software Development Organisation has a basic and consistent project management processes to track cost, schedule, and functionality.
- The process is in place to repeat the earlier successes on projects with similar applications.
- Program management is a key characteristic of a level two organisation.
The level 3 of maturity
- Level Three: Defined
- The software process for both management and engineering activities are documented, standardised, and integrated into a standard software process.
- They are for the entire organisation and all projects across the organisation use an approved, tailored version of the organisation's standard software process for developing, testing and maintaining the application.
The level 4 of maturity
- Level Four: Managed
- Management can effectively control the software development effort using precise measurements.
- At this level, organisation set a quantitative quality goal for both software process and software maintenance.
- At this maturity level, the performance of processes is controlled using statistical and other quantitative techniques, and is quantitatively predictable.
The level 5 of maturity
- Level Five: Optimising
- The Key characteristic of this level is focusing on continually improving process performance through both incremental and innovative technological improvements.
- At this level, changes to the process are to improve the process performance and at the same time maintaining statistical probability to achieve the established quantitative process-improvement objectives.
-
Example of CMM
- Software CMM: enhance a software focused development and maintenance capability
- People CMM: develop, motivate and retain project talent.
- (Data source: www.tutorialspoint.com)
Immature VS mature organisation
- here are following characteristics of an immature organisation:
- Process improvised during project
- Approved processes being ignored
- Reactive, not proactive
- Unrealistic budget and schedule
- Quality sacrificed for schedule
- No objective measure of quality
- There are following characteristics of an mature organisation:
- Inter-group communication and coordination
- Work accomplished according to plan
- Practices consistent with processes
- Processes updated as necessary
- Well defined roles/responsibilities
- Management formally commits
- Data source: http://www.tutorialspoint.com/cmmi/cmmi-overview.htm
CMMI Levels
- CMMI levels, from lowest to highest, are:
- Incomplete
- Performed
- Managed
- Defined
- Quantitatively Managed
- Optimising
- Companies may not get to bid on government projects unless they have a CMMI Level 3
PMI’s Maturity Model
- PMI released the Organisational Project Management Maturity Model (OPM3) in December 2003
- Model is based on market research surveys sent to more than 30,000 project management professionals and incorporates 180 best practices and more than 2,400 capabilities, outcomes, and key performance indicators
- Addresses standards for excellence in project, program, and portfolio management best practices and explains the capabilities necessary to achieve those best practices
Best Practice
- OPM3 provides the following example to illustrate a best practice, capability, outcome, and key performance indicator:
- Best practice: Establish internal project management communities
- Capability: Facilitate project management activities
- Outcome: Local initiatives, meaning the organisation develops pockets of consensus around areas of special interest
- Key performance indicator: Community addresses local issues
Using Software to Assist in Project Quality Management
- Spreadsheet and charting software helps create Pareto diagrams, fishbone diagrams, and so on
- Statistical software packages help perform statistical analysis
- Specialised software products help manage Six Sigma projects or create quality control charts
- Project management software helps create Gantt charts and other tools to help plan and track work related to quality management
Chapter Summary
- Project quality management ensures that the project will satisfy the needs for which it was undertaken
- Main processes include:
- Plan quality
- Perform quality assurance
- Perform quality control
-
Quick Quiz
- 1. Define quality and what is meant by stated and implied needs.
- Reveal Answer
- ANSWER: Quality is the totality of characteristics of an entity that bear on its ability to satisfy stated or implied needs or the degree to which a set of inherent characteristics fulfil requirements. Stated needs are formally communicated either verbally or in writing. Implied needs mean the product is fit for use or can be used as it was intended.
- 2. Who created fishbone diagrams, and what are they used for?
- Reveal Answer
- ANSWER: Ishikawa developed fishbone diagrams, and they are used to trace complaints about quality problems back to the responsible production operations to find the root cause..
-
Key Terms
- 5 whys: A technique in which you repeatedly ask the question “Why?” to help peel away the layers of symptoms that can lead to the root cause of a problem
- Acceptance decisions: Decisions that determine if the products or services produced as part of the project will be accepted or rejected
- Appraisal cost: The cost of evaluating processes and their outputs to ensure that a project is error-free or within an acceptable error range
- Benchmarking: A technique used to generate ideas for quality improvements by comparing specific project practices or product characteristics to those of other projects or products within or outside the performing organization
- Capability Maturity Model Integration (CMMI): A process improvement approach that provides organizations with the essential elements of effective processes
- Cause-and-effect diagram: A diagram that traces complaints about quality problems back to the responsible production operations to help find the root cause; also known as a fishbone diagram or Ishikawa diagram
- Checksheet : A technique used to collect and analyse data; sometimes called a tally sheet or checklist
- Conformance: Delivering products that meet requirements and fitness for use
- Conformance to requirements: Project processes and products that meet written specifications
- Control chart: A graphic display of data that illustrates the results of a process over time
- Cost of non-conformance: Taking responsibility for failures or not meeting quality expectations
- Cost of quality: The cost of conformance plus the cost of non-conformance
- Defect: Any instance in which the product or service fails to meet customer requirements
- Design of experiments: A quality technique that helps identify which variables have the most influence on the overall outcome of a process
- Features: The special characteristics that appeal to users
- Fishbone diagram: A diagram that traces complaints about quality problems back to the responsible production operations to help find the root cause; also known as a cause-and-effect diagram or Ishikawa diagram
- Flowchart: A graphic display of the logic and flow of processes that helps you analyze how problems occur and how processes can be improved
- Functionality: The degree to which a system performs its intended function
- Integration testing: Testing that occurs between unit and system testing to test functionally grouped components and ensure that a subset or subsets of the entire system work together
- Ishikawa diagram A diagram that traces complaints about quality problems back to the responsible production operations to help find the root cause; also known as a cause-and-effect diagram or fishbone diagram
- ISO 9000 A quality system standard developed by the International Organization for Standardization (ISO) that includes a three-part, continuous cycle of planning, controlling, and documenting quality in an organization
- Kaizen: The Japanese word for improvement or change for the better; an approach used for continuously improving quality in organizations
- Lean: An approach for improving quality that involves evaluating processes to maximize customer value while minimizing waste
- Maintainability: The ease of performing maintenance on a product
- Maturity model: A framework for helping organizations improve their processes and systems
- Metric: A standard of measurement
- Performance: How well a product or service performs the customer’s intended use
- Project quality management: Ensuring that a project will satisfy the needs for which it was undertaken
- Quality: The totality of characteristics of an entity that bear on its ability to satisfy stated or implied needs or the degree to which a set of inherent characteristics fulfill requirements
- Quality assurance: Periodic evaluation of overall project performance to ensure that the project will satisfy the relevant quality standards
- Quality audit: A structured review of specific quality management activities that helps identify lessons learned and that can improve performance on current or future projects
- Quality control: Monitoring specific project results to ensure that they comply with the relevant quality standards and identifying ways to improve overall quality
- Reliability: The ability of a product or service to perform as expected under normal conditions
- Rework: Action taken to bring rejected items into compliance with product requirements, specifications, or other stakeholder expectations
- Six Sigma A comprehensive and flexible system for achieving, sustaining, and maximizing business success that is uniquely driven by close understanding of customer needs, disciplined use of facts, data, and statistical analysis, and diligent attention to managing, improving, and reinventing business processes
- Software defect: Anything that must be changed before delivery of the program
- System outputs: The screens and reports the system generates
- System testing: Testing the entire system as one entity to ensure that it is working properly
- Unit test: A test of each individual component (often a program) to ensure that it is as defect-free as possible
- User acceptance testing: An independent test performed by end users prior to accepting the delivered system