Wk 2
- Equation of a Sine Wave
– The angular frequency $\omega$ can be thought of as the rate at which the angle of the sine wave changes.
– at any time.
$\bbox[lightblue,6pt]{\theta = \omega t}$
– therefore$\bbox[lightblue,6pt]{V = V_p \; sin \; \omega t}$ or $\bbox[lightblue,6pt]{V = V_p \; sin \; 2 \pi ft}$– similarly$\bbox[lightblue,6pt]{\; i = I _p \; sin \; \omega t}$ or $\bbox[lightblue,6pt]{i = I _p \; sin \; 2 \pi ft}$
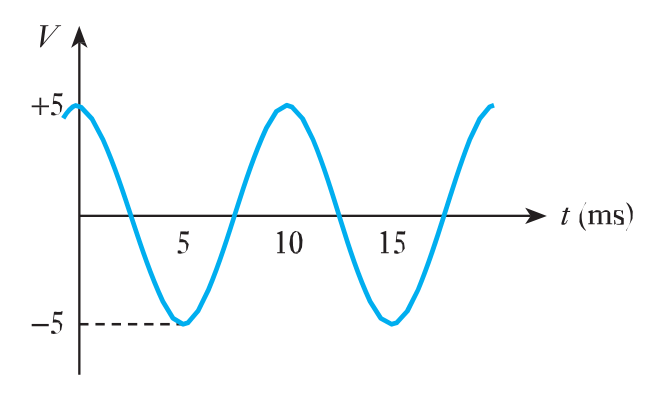
- Example - see Example 2.2 in the course text.Determine the equation of the following voltage signal.
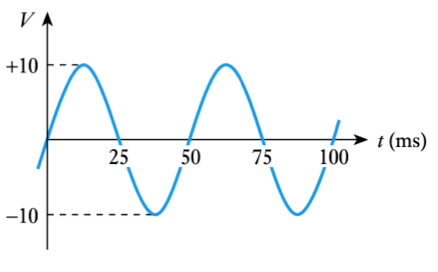
– From the diagram:- Period is $50$ms = $0.05$ s
- Thus $f = 1/ \text{T} = 1/0.05 = 20$ Hz
- Peak voltage is $10$ V
- Therefore,
\begin{align*} v =& V_p \text{ sin } 2\pi ft \\ =& 10 \text{ sin } 2\pi 20t \\ =& 10 \text{ sin } 126t \end{align*}
Sine Waves
- 🎥 Watch an Introduction and sine waves video - Adobe Flash video
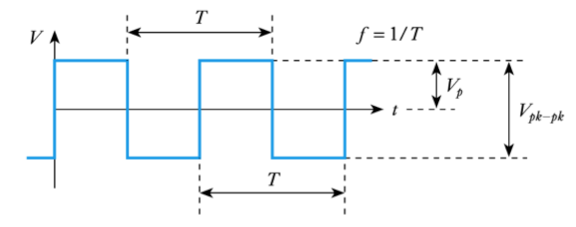
- Sine Waves
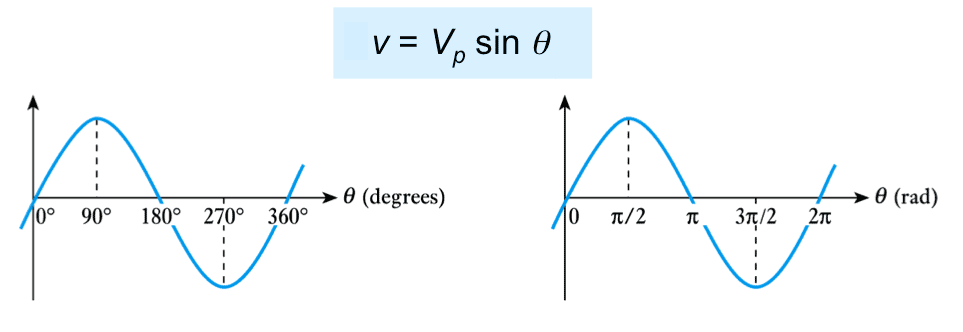
– by far the most important form of alternating quantity.- 📷 important properties of a sine wave are shown in this diagram.
- Instantaneous Value
– shape of the sine wave is defined by the sine function $ y = A \text{ sin } \theta $
– in a voltage waveform.
- Angular Frequency
– frequency $f$ (in hertz) is a measure of the number of cycles per second
– each cycle consists of $2 \pi $ radians
– therefore there will be $2 \pi f$ radians per second
– this is the angular frequency $\omega$ (units are rad/s).
$\bbox[lightblue,6pt]{\omega = 2\pi f}$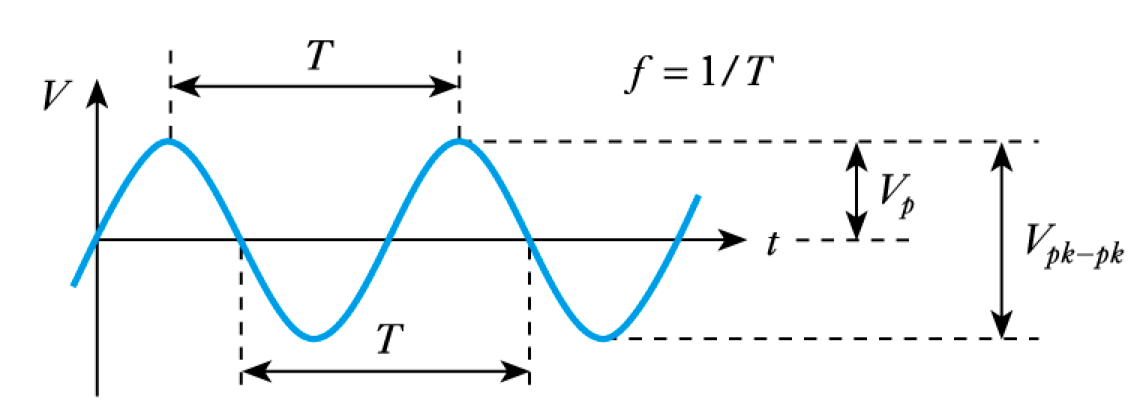
- Equation of a Sine Wave
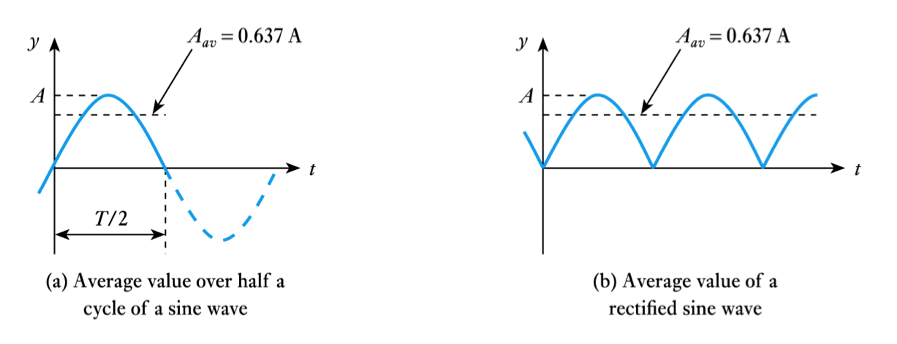
- Average value of a sine wave
– average value over one (or more) cycles is clearly zero.
– however, it is often useful to know the average magnitude of the waveform independent of its polarity.- we can think of this as the average value over half a cycle…
- … or as the average value of the rectified signal
- \begin{align*} \large V_{av} &= \frac{\large 1}{\large \pi} \large \int _{\large _0}^{\large \pi}\large V _p \; sin \theta \; d\theta \\\\ &= \frac {\large V_p}{\large \pi} [-cos\theta] _{\large _0}^{\large ^\pi} \\\\ &= \frac {\large 2 V_p}{\large \pi} = 0.637 \times \large V_p \end{align*}
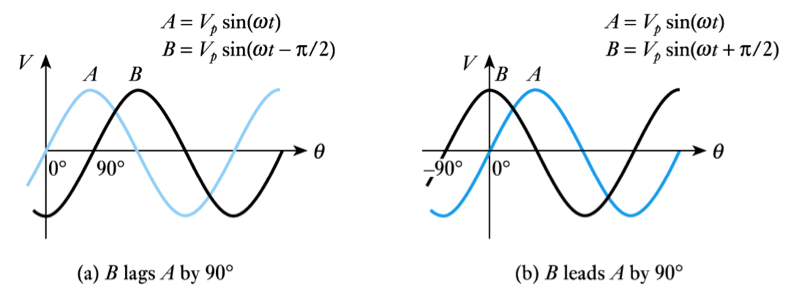
- Phase angles
– The expressions given above assume the angle of the sine wave is zero at $t = 0$
– If this is not the case the expression is modified by adding the angle at $t = 0$
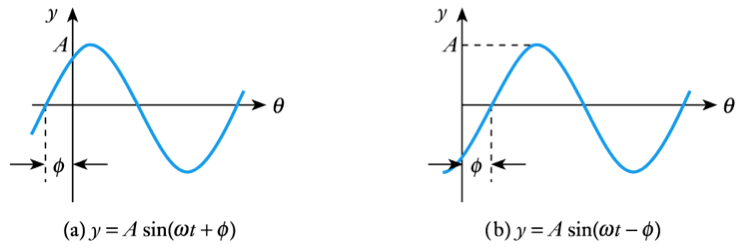
- Phase difference
– Two waveforms of the same frequency may have a constant phase difference.- We say that one is phase-shifted with respect to the other.
- Average value of a sine wave
- Form factor
– for any waveform the form factor is defined as
$\text{Form factor} = \frac{\large \text{r.m.s. value} }{ \large\text{average value}} $
– for a sine wave this gives
$\text{Form factor} = \frac{\large 0.707 \; V _p }{\large 0.637 \; V_p} = 1.11$- Peak factor
– for any waveform the peak factor is defined as
$\text{Peak factor} = \frac{\large \text{peak value} }{\large \text{r.m.s. value}} $
– for a sine wave this gives
$\text{Peak factor} = \frac{\large V _p }{\large 0.707 \; V_p} = 1.414$
- r.m.s. value of a sine wave
– the instantaneous power (p) in a resistor is given by.
$p = \large \frac{v^2}{R} \\$
– therefore the average power is given by.
$P _{\large av} = \frac{\large [\text{average (or mean) of} \; v^2]}{\large R} = \frac {\overline{\large v^2}}{\large R} \\$– where $\overline{ v^2}$ is the mean-square voltage.
- While the mean-square voltage is useful, more often we use the square root of this quantity, namely the root-mean-square voltage $V$rms
– where $V$rms = $\sqrt{\overline{\large v^2}}$
– we can also define Irms = $\sqrt{\overline{\large i^2}}$
– it is relatively easy to show that (see text for analysis).
\begin{align*} \large V_{rms} &= \frac{\large 1}{\sqrt{2}} \times \large V _p \normalsize = 0.707 \times \large V_p \end{align*}\begin{align*} \large I_{rms} &= \frac{\large 1}{\sqrt{2}} \times \large I _p \normalsize = 0.707 \times \large I_p \end{align*}
- r.m.s. values are useful because their relationship to average power is similar to the corresponding DC values.
\begin{align*} \large P_{av} &= \large V_{rms} \large \; I _{rms} \end{align*}\begin{align*} \large P_{av} &= \frac{\large V_{rms} \;^2 }{R} \end{align*}\begin{align*} \large P_{av} &= \large I_{rms} \large ^2 R \end{align*}- Form factor
- Average and r.m.s. values
– the average value of a symmetrical waveform is its average value over the positive half-cycle
– thus the average value of a symmetrical square wave is equal to its peak value \begin{align*}\large V _{av} = V_p \end{align*}– similarly, since the instantaneous value of a square wave is either its peak positive or peak negative value, the square of this is the peak value squared, and
\begin{align*}\large V _{rms} = V_p \end{align*}- Form factor and peak factor
– from the earlier definitions, for a square wave.$\text{Form factor} = \frac{\large \text{r.m.s. value} }{\large \text{average value}} = \frac{\large V_p}{\large V_p} = 1.0$$\text{Peak factor} = \frac{\large \text{peak value} }{\large \text{r.m.s. value}} = \frac{\large V_p}{\large V_p} = 1.0$
Square Waves
- Frequency, period, peak value and peak-to-peak value have the same meaning for all repetitive waveforms
- Phase angle
– we can divide the period into 360° or 2π radians
– useful in defining phase relationship between signals
– we could alternatively give the time delay of one with respect to the other.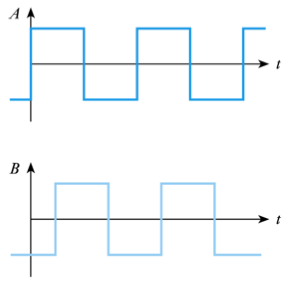
- Average and r.m.s. values
- Loading effects – voltage measurement
– our measuring instrument will have an effective resistance ($R_M$)
– when measuring voltage we connect a resistance in parallel with the component concerned which changes the resistance in the circuit and therefore changes the voltage we are trying to measure
Measuring Voltages and Currents
- 🎥 Watch a video on triangular waves - Adobe Flash video
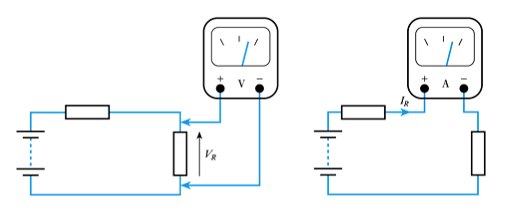
- Measuring voltage and current in a circuit
– when measuring voltage we connect across the component.
– when measuring current we connect in series with the component.
- Loading effects – voltage measurement
- Measuring alternating quantities
– Moving coil meters respond to both positive and negative voltages, each producing deflections in opposite directions.
– a symmetrical alternating waveform will produce zero deflection (the mean value of the waveform).
– therefore we use a rectifier to produce a unidirectional signal.
– meter then displays the average value of the waveform.
– meters are often calibrated to directly display r.m.s. of sine waves.all readings are multiplied by 1.11 - the form factor for a sine wave.– as a result waveforms of other forms will give incorrect readings.for example when measuring a square wave (for which the form factor is 1.0, the meter will read 11% too high).
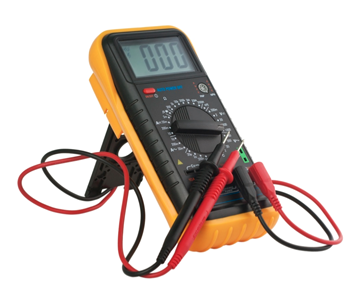
- Analogue multimeters
– general purpose instruments use a combination of switches and resistors to give a number of voltage and current ranges.
– a rectifier allows the measurement of AC voltage and currents
– additional circuitry permits resistance measurement
– very versatile but relatively low input resistance on voltage ranges produces considerable loading in some situations
– 📷 View a typical analogue multimeter.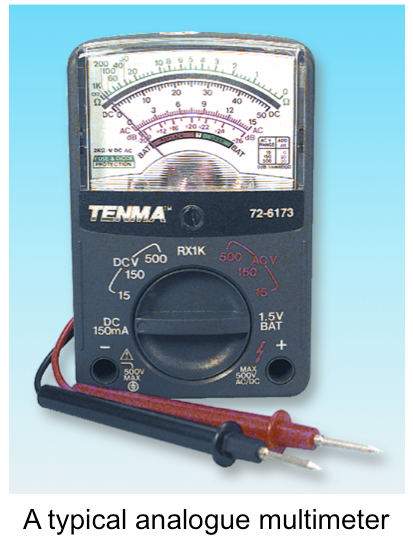
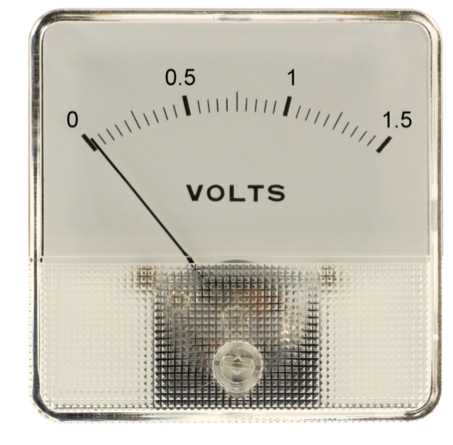
Analogue Ammeters and Voltmeters
- Most modern analogue ammeters are based on moving coil meters
– see Chapter 13 of textbook.
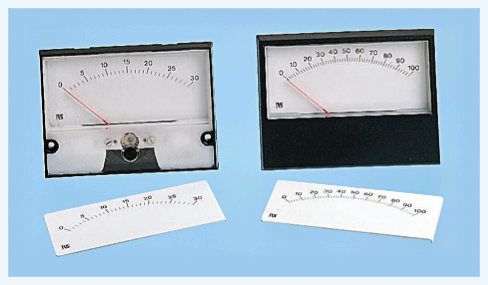
- Meters are characterised by their full-scale deflection (f.s.d.) and their effective resistance ($R_M$)
– typical meters produce a f.s.d. for a current of $50 \mu \text{A} - 1$ mA
– typical meters have an $R_M$ between a few ohms and a few kilohms
- Measuring direct currents using a moving coil meter
– 📷 use a shunt resistor to adjust sensitivity (can be seen here)– see Example 2.5 in the set text for numerical calculations.
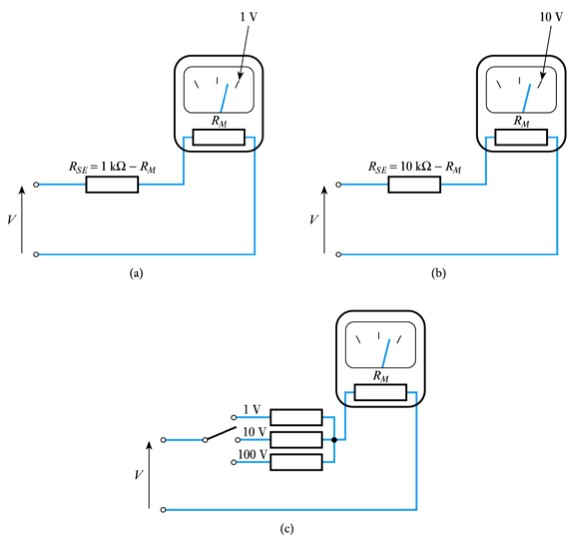
- Measuring direct voltages using a moving coil meter
– 📷 use a series resistor to adjust sensitivity– see Example 2.6 in the set text for numerical calculations.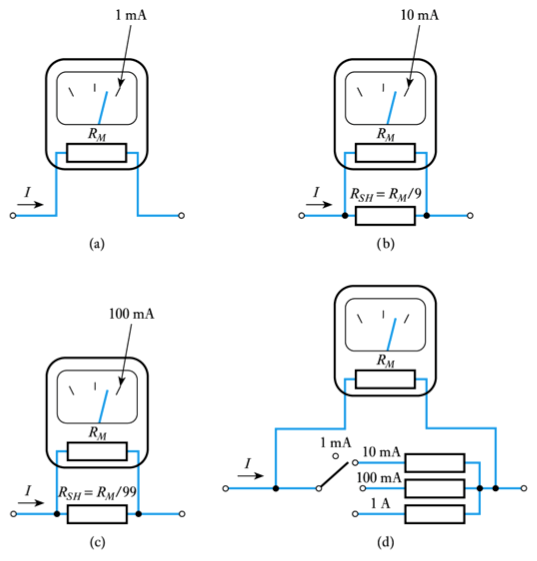
- Measuring alternating quantities
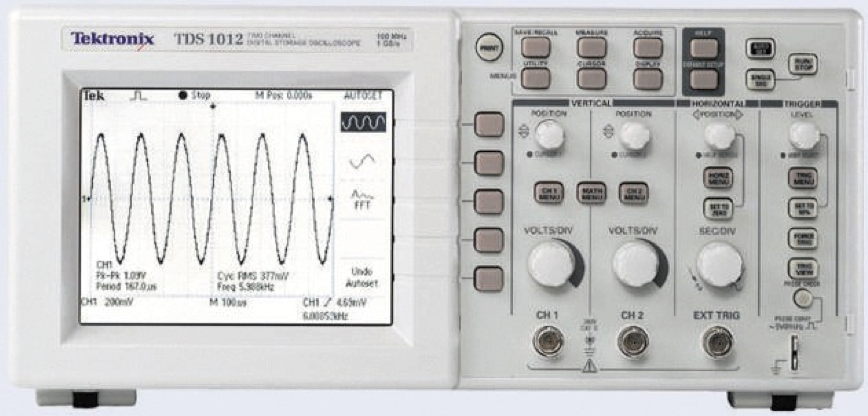
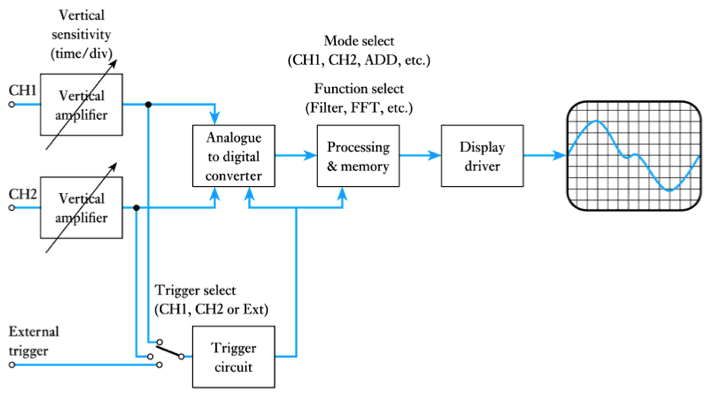
Digital oscilloscope
- Digital oscilloscopes use an analogue-to-digital converter (ADC) and appropriate processing.
- A typical digital oscilloscope
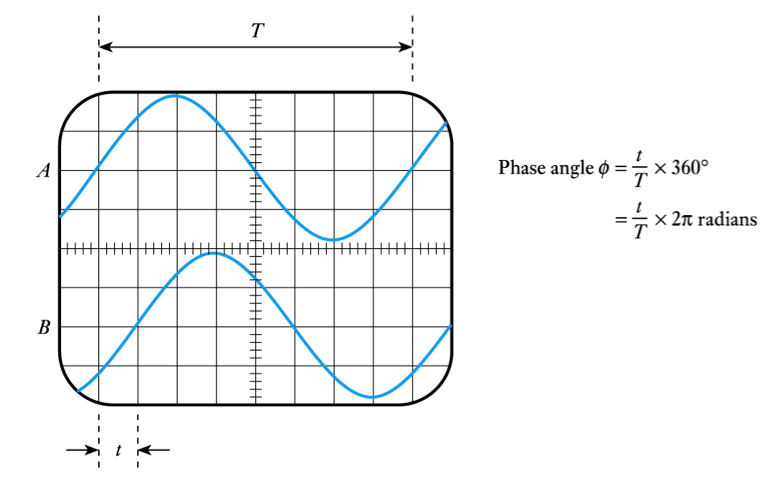
- Measurement of phase difference
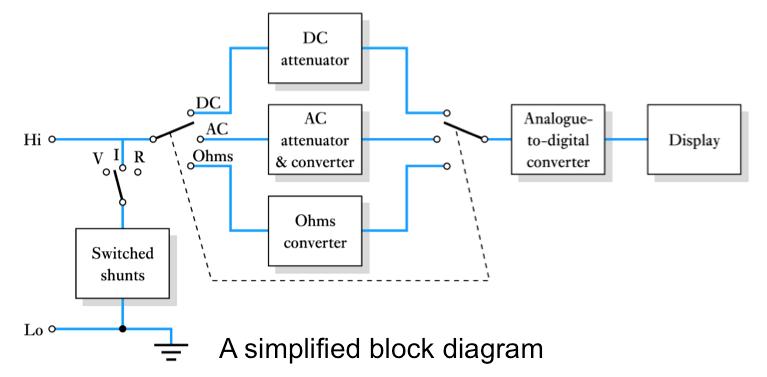
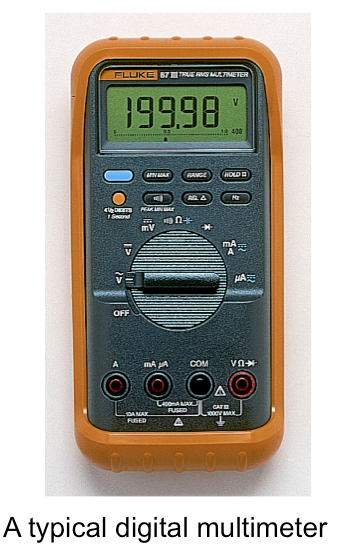
Digital Multimeters
- Digital multimeters (DMMs) are often (inaccurately) referred to as digital voltmeters or DVMs.
– 📷 at their heart is an analogue-to-digital converter (ADC) - see here.- Measurement of voltage, current and resistance is achieved using appropriate circuits to produce a voltage proportional to the quantity to be measured.
– in simple DMMs alternating signals are rectified as in analogue multimeters to give its average value which is multiplied by 1.11 to directly display the r.m.s. value of sine waves
– more sophisticated devices use a true r.m.s. converter which accurately produced a voltage proportional to the r.m.s. value of an input waveform
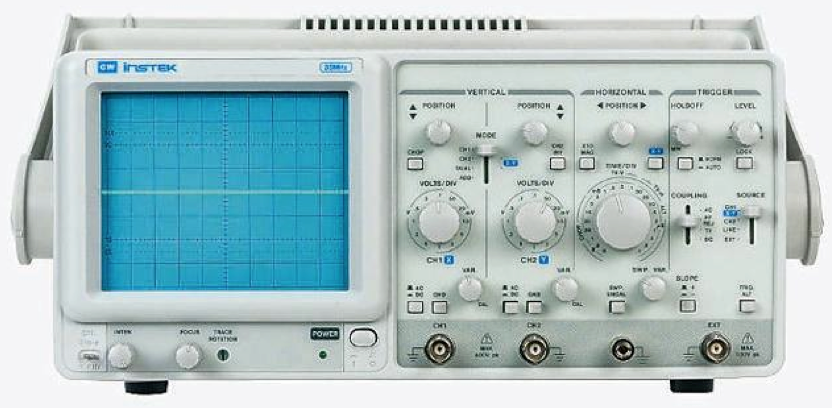
Oscilloscopes
- An oscilloscope displays voltage waveforms
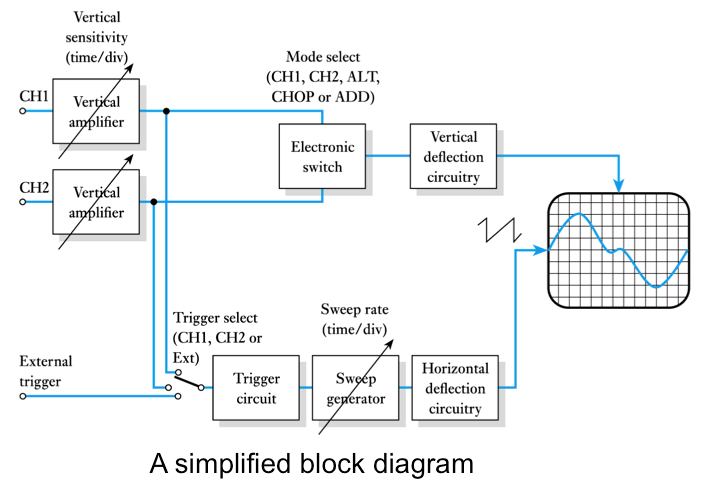
- A typical analogue oscilloscope
Further Study
- 🎥 Watch a further study video on power measurement with alternating signals - Adobe Flash video
- The Further Study section at the end of Chapter 2 looks at the measurement of different forms of alternating waveform.
- Have a look at the problem and then watch the video to see how you did.
Key Points
- The magnitude of an alternating waveform can be described by its peak, peak-to-peak, average or r.m.s. value.
- The root-mean-square value of a waveform is the value that will produce the same power as an equivalent direct quantity.
- Simple analogue ammeter and voltmeters are based on moving coil meters.
- Digital multimeters are easy to use and offer high accuracy.
- Oscilloscopes display the waveform of a signal and allow quantities such as phase to be measured.
-
- 2.11 What are the frequency and peak amplitude of the waveform described by the following equation?
$v = 25 \text{ sin } 471 t$- 2.12 Determine the equation of the following voltage signal.
- 2.13 A sine wave has a peak value of $10$. What is its average value?
- 2.14 A sinusoidal current signal has an average value of $5$ A. What is its peak value?
- 2.15 Explain what is meant by the mean‐square value of an alternating waveform. How is this related to the r.m.s. value?
- 2.16 Why is the r.m.s. value a more useful quantity than the average value?
- 2.17 A sinusoidal voltage signal of $10$ V peak is applied across a resistor of $25 \Omega$. What power is dissipated in the resistor?
- ⬇Download chapter 2 tutorial
Exercises
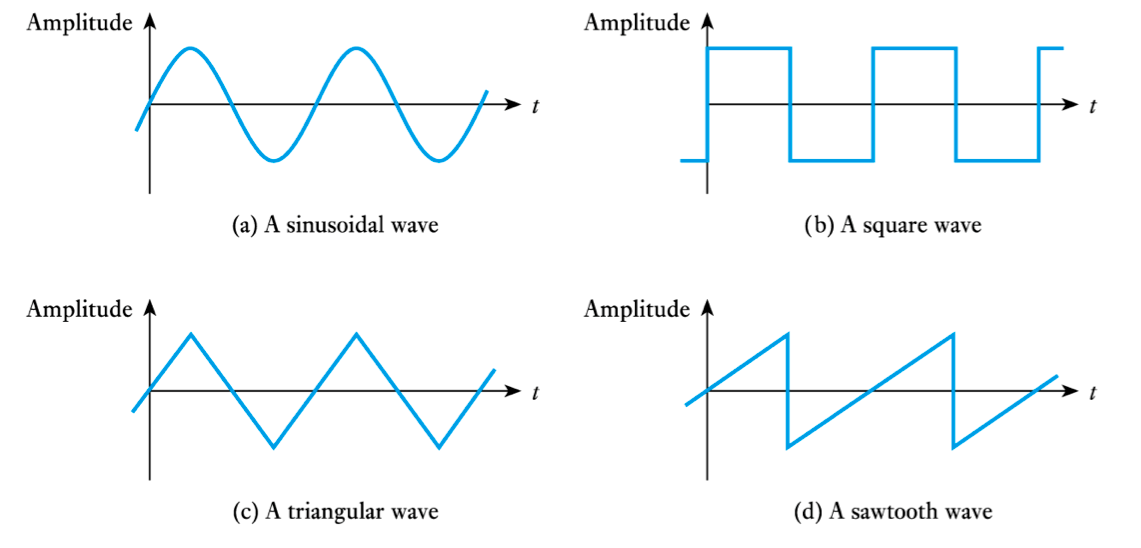
- 2.1 Sketch three common forms of alternating waveform.
- 2.2 A sine wave has a period of $10$ s. What is its frequency (in hertz)?
- 2.3 A square wave has a frequency of $25$ Hz. What is its period?
- 2.4 A triangular wave (see textbook Figure 2.1) has a peak amplitude of 2.5 V. What is its peak‐to-peak amplitude?
- 2.5 What is the peak‐to‐peak current of the waveform described by the following equation?
$i = 10 \text{ sin } \theta$
- 2.6 A signal has a frequency of $10$ Hz. What is its angular frequency?
- 2.7 A signal has an angular frequency of $157$ rad/s. What is its frequency in hertz?
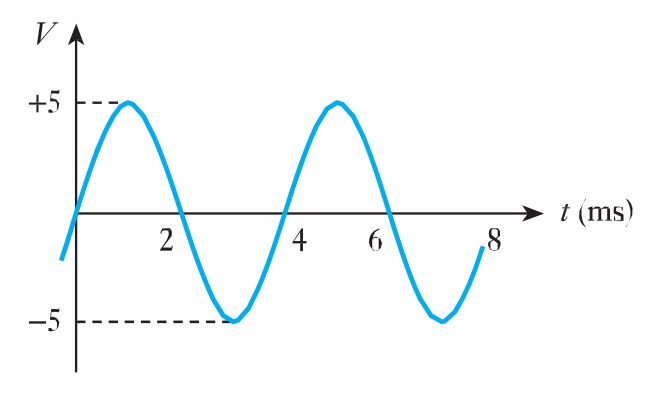
- 2.8 Determine the peak voltage, the peak‐to‐peak voltage, the frequency (in hertz) and the angular frequency (in rad/s) of the following waveform.
- 2.9 Write an equation to describe a voltage waveform with an amplitude of $5$ V peak and a frequency of $50$ Hz.
- 2.10 Write an equation to describe a current waveform with an amplitude of $16$ A peak to peak and an angular frequency of $150$ rad/s.
- 2.11 What are the frequency and peak amplitude of the waveform described by the following equation?
-
- 2.27 How do some digital multimeters overcome the problem associated with different alternating waveforms having different form factors?
- 2.28 Explain briefly how an analogue oscilloscope displays the amplitude of a time-varying signal.
- 2.29 How is an analogue oscilloscope able to display two waveforms simultaneously?
- 2.30 What is the difference between the ALT and CHOP modes on an analogue oscilloscope?
- 2.31 What is the function of the trigger circuitry in an oscilloscope?
- 2.32 A sinusoidal waveform is displayed on an oscilloscope and has a peak-to-peak amplitude of $15$ V. At the same time, the signal is measured on an analogue multimeter that is set to measure alternating voltages. What value would you expect to be displayed on the multimeter?
- 2.33 Comment on the relative accuracies of the two measurement methods outlined in the last exercise.
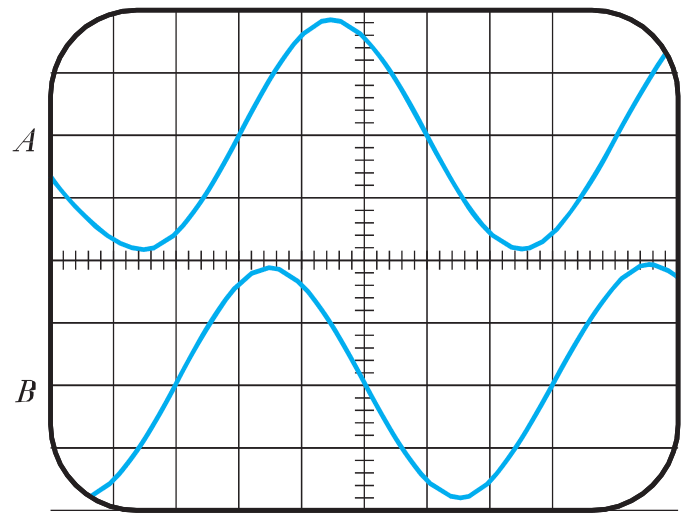
- 2.34 What is the phase difference between waveforms A and B in the following oscilloscope display? Which waveform is leading and which lagging?
- ⬇ Tutorial Solutions
Exercises (cont.)
- 2.18 A sinusoidal voltage signal of $10$ V r.m.s. is applied across a resistor of $25 \Omega$. What power is dissipated in the resistor?
- 2.19 A sinusoidal waveform with an average voltage of 6 V is measured by an analogue multimeter. What voltage will be displayed?
- 2.20 A square‐wave voltage signal has a peak amplitude of 5 V. What is its average value?
- 2.21 A square wave of $5$ V peak is applied across a $25 \Omega$ resistor. What will be the power dissipated in the resistor?
- 2.22 A moving‐coil meter produces a full‐scale deflection for a current of $50 \mu$A and has a resistance of $10 \Omega$. Select a shunt resistor to turn this device into an ammeter with an f.s.d. of $250$ mA.
- 2.23 A moving‐coil meter produces a full‐scale deflection for a current of 50 μA and has a resistance of $10 \Omega$. Select a series resistor to turn this device into a volt‐ meter with an f.s.d. of $10$ V.
- 2.24 What percentage error is produced if we measure the voltage of a square wave using an analogue multimeter that has been calibrated to display the r.m.s. value of a sine wave?
- 2.25 A square wave of $10$ V peak is connected to an analogue multimeter that is set to measure alternating voltages. What voltage reading will this show?
- 2.26 Describe the basic operation of a digital multimeter.