02
-
- Pure Substance:
- ● A substance that has a fixed chemical composition throughout
● Water, nitrogen, helium, and carbon dioxide, for example, are all pure substance.
● It can be a mixture of various chemical elements or compounds.
Air, for example, is a mixture of several gases, but is considered to be a pure substance because it has a uniform chemical composition.
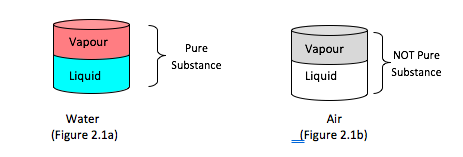
● A mixture of two or more phases of a pure substance is still a pure substance as long as the chemical composition of all phases is the same
A mixture of vapour and liquid water is a pure substance (Figure 2.1a)
A mixture of liquid air and gaseous air is a not a pure substance (Figure 2.1b)
Phases of Pure Substances:
_ a pure substance may exist in different phases, where a phase is considered to be a physically uniform form of the matter
_ Three principal phases:
Solid → liquid → gas
A substance may have several phases within a principal phase, each with a different molecular structure. For example, carbon may exist in as graphite or diamond in the solid phase, and ice may exist in seven different phases at high pressure.
Molecular bonds are the strongest in solids and the weakest in gases.
Solid: the molecules are arranged in a three-dimensional pattern (lattice) throughout the solid. The molecules cannot move relative to each other; however, they continually oscillate about their equilibrium position.
Liquid: the molecular spacing in liquid phase is not much different from that of the solid phase (generally slightly higher), except the molecules are no longer at fixed positions relative to each other.
Gas: the molecules are far apart from each other, and a molecular order does not exist. Gas molecules move randomly, and continually collide with each other and the walls of the container they are in.
Molecules in the gas phase are at a considerably higher energy level than they are in liquids or solid phases. -
- Behaviour of Pure Substances (Phase Change Processes
- _ phase change processes:
– the following diagram (Figure 2.2)shows the typical behaviour of pure substances
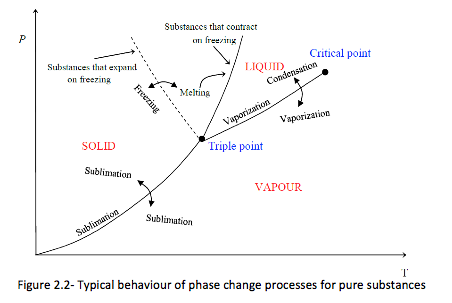
The P-T or Phase Change Diagram
This is called phase diagram since all three phases are separated from each other by three lines. Most pure substances exhibit the same behaviour.
⇒ One exception is water. Water expands upon freezing.
There are two ways that a substance can pass from solid phase to vapour phase
i) it melts first into a liquid and subsequently evaporates,
ii) it evaporates directly without melting (sublimation).
⇒ the sublimation line separates the solid and the vapour.
⇒ the vaporization line separates the liquid and vapour regions
⇒ the melting or fusion line separates the solid and liquid.
⇒ these three lines meet at the triple point.
• if P < PTP , the solid phase can change directly to a vapour phase
• at P < PTP the pure substance cannot exist in the liquid phase. Normally (P > PTP) the substance melts into a liquid and then evaporates.
• matter (like CO2) which has a triple point above 1 atm sublimate under atmospheric conditions (dry ice)
• for water (as the most common working fluid) we are mainly interested in the liquid and vapour regions. Hence, we are mostly interested in boiling and condensation.
-
- Phase-change processes of pure substances
- In several applications two phases coexist in the same device (example: in refrigerators; the refrigerant turns from liquid to vapour in the freezer).
In this part, we will focus our attention on the coexistence of liquid and vapour phases. Why? Because remember that in thermodynamics, “dynamics” means “power”, and almost all power plants use the conversion of a liquid to gas to generate power.
Let's consider the results of heating liquid water from 20oC, 1 atm while keeping the pressure constant. We will follow the constant pressure process shown in Figure 2.3 below. First place liquid water in a piston-cylinder device where a fixed weight is placed on the piston to keep the pressure of the water constant at all times. As liquid water is heated while the pressure is held constant, the following events occur.
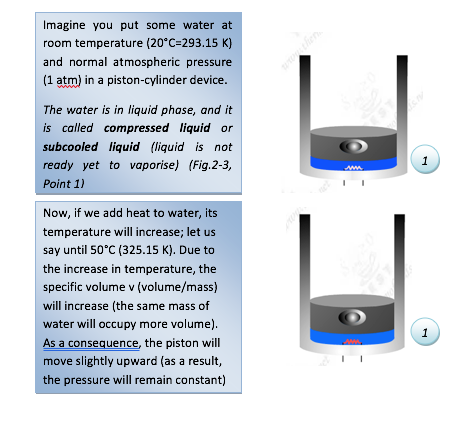
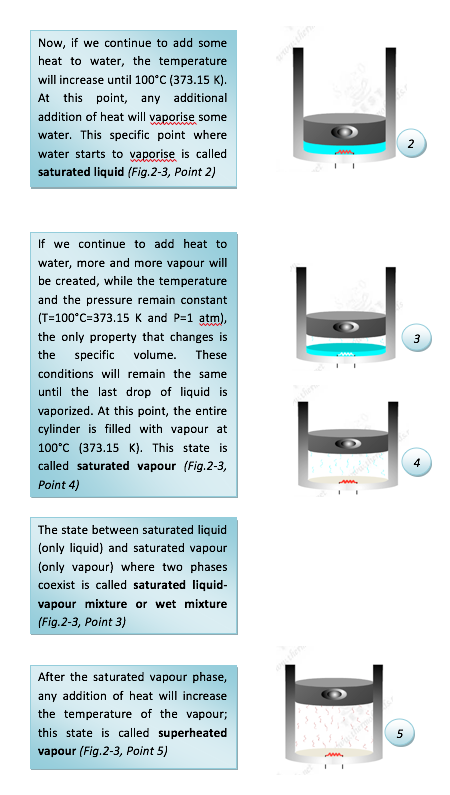
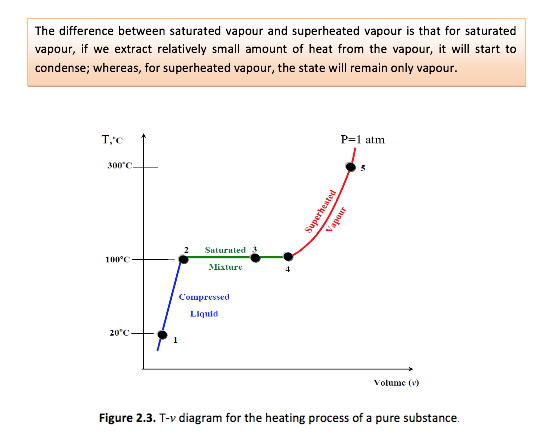
• At a given pressure, the temperature at which a pure substance starts boiling is called the saturation temperature, Tsat.
• Likewise, at a given temperature, the pressure at which a pure substance starts boiling is called the saturation pressure, Psat.
• During a phase-change process, pressure and temperature are dependent properties, Tsat = ƒ (Psat).
Latent heat
The energy absorbed during vaporization is called latent heat of vaporization and it is equivalent to the energy released during condensation.
For example at 1 atm, the latent heat of vaporization of water is 2257.1 kJ/kg.
Note: the latent energy is a function of the temperature and the pressure at which the phase change occurs.
Relation between the saturation temperature and the saturation pressure
In all pure substances, the relation between the temperature of saturation and the pressure of saturation can be plotted under the following form:
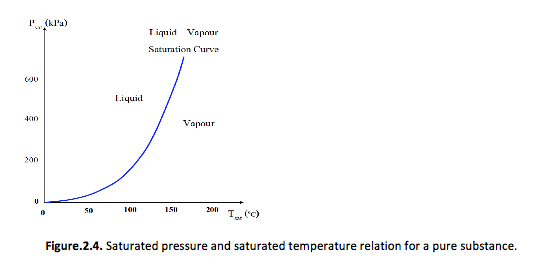
One of the consequences of the dependence of the saturation temperature upon the saturation pressure is that we are able to control the boiling temperature of a pure substance by changing its pressure. -
- Property diagrams for phase-change processes
- T-v Diagram
If we increase the pressure of water in the piston-cylinder device, the process from compressed liquid to superheated vapour will follow a path that looks like the process for P=1 atm (see Figure 2.3), the only difference is that the width of the mixture region will be shorter.
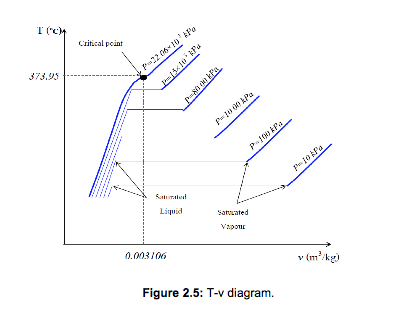
Then, at a certain pressure, the mixture region will be represented only by one point (see Figure 2.5). This point is called the critical point. It is defined as the point at which the saturated liquid and saturated vapour states are identical.
At the critical point, the properties of a substance are called critical properties (critical temperature (Tcr), critical pressure (Pcr) and critical specific volume (Vcr)).
For example:
Water Pcr = 22.09 MPa
Tcr = 374.148°C = 647.298 K
vcr = 0.003155 m3/kg
Air Pcr = 3.77 MPa
Tcr = 132.5°C = 405.65 K
vcr = 0.0883 m3/kg
Above the critical point, there is only one phase that will resemble to a vapour, but we are unable to say when the change has occurred -
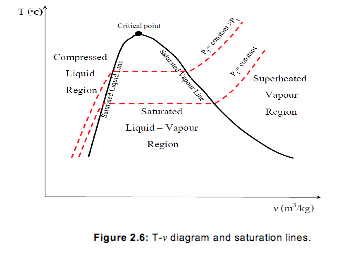
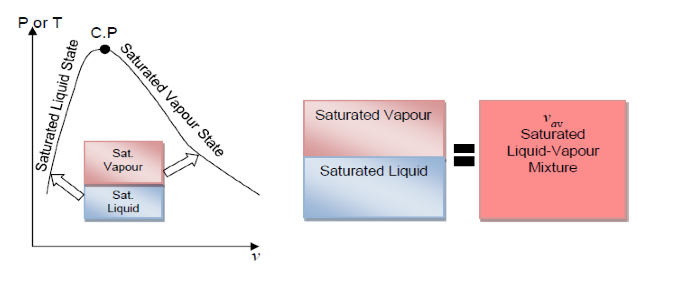
- Saturated liquid and saturated vapour lines
- If all of the saturated liquid states are connected, the saturated liquid line is established. If all of the saturated vapor states are connected, the saturated vapor line is established. These two lines intersect at the critical point and form what is often called the “steam dome.” The region between the saturated liquid line and the saturated vapor line is called by these terms: saturated liquid-vapor mixture region, wet region (i.e., a mixture of saturated liquid and saturated vapor), two-phase region, and just the saturation region. Notice that the trend of the temperature following a constant pressure line is to increase with increasing volume and the trend of the pressure following a constant temperature line is to decrease with increasing volume.
If we connect all the points representing saturated liquid we will obtain the saturated liquid line.
If we connect all the points representing saturated vapour we will obtain the saturated vapour line.
The intersection of the two lines is the critical point.
P-v Diagram
If we consider the pressure-cylinder device, but with some weights above the piston, if we remove the weights one by one to decrease the pressure, and we allow a heat transfer to obtain an isothermal process, we will obtain one of the curves of the P-v diagram (Figure 2.7)
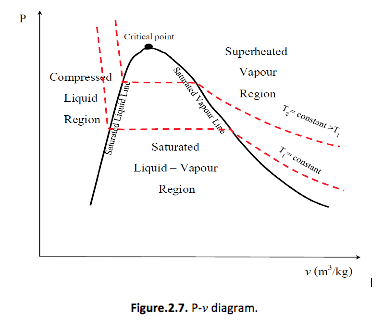
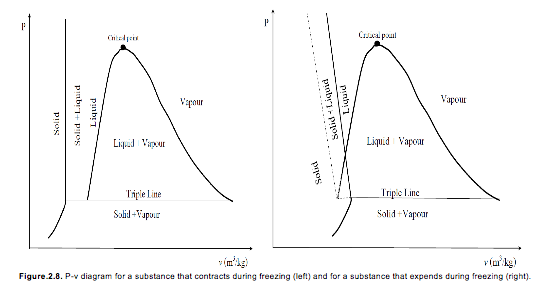
The P-v diagram can be extended to include the solid phase, the solid-liquid and the solid-vapour saturation regions.
As some substances, as water, expand when they freeze, and the rest (the majority) contracts during freezing process, we have two configurations for the P-v diagram with solid phase.
P-T Diagram
The P-T diagram is often called the phase diagram since all three phases are separated by three lines.
Solid → vapour sublimation
Solid → liquid melting
Liquid → vapour vaporization
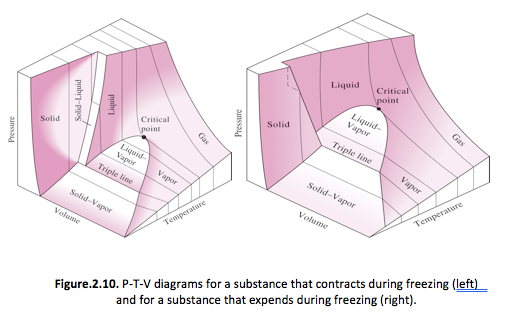
The P-T-v Surface
The P-v-T surfaces provide a great deal of information at a glance. In thermodynamics it is more convenient to work with 2-dimensional diagrams, such as the P-v and T-v diagrams. (consult textbook on P-v-T diagram).
-
- Property Tables
- For most substances, the relationships among thermodynamic properties are too complex to be expressed by simple equations. Thus, properties are frequently presented in the form of tables.
● Some thermodynamic properties can be measured easily, but others cannot and are calculated by using the relations between them and measurable properties.
● The results of these measurements and calculations are presented in tables in a convenient format.
The subscript “f” is used to denote properties of a saturated liquid and “g” for saturated vapour. Another subscript, “fg”, denotes the difference between the saturated vapour and saturated liquid values of the same property.
For example:
vf = specific volume of saturated liquid vg = specific volume of saturated vapour vfg = difference between vg and vf ( vfg = vg – vf)
In addition to the temperature, pressure, and volume data, the tables contain the data for the specific internal energy u the specific enthalpy h and the specific entropy s. The combination u + Pv is frequently encountered in the analysis of control volumes and hence the enthalpy is a conveniently grouped together to form new property called enthalpy and is given by
H = U + PV and the enthalpy per unit mass is h = u + Pv
Enthalpy of vaporization (or latent heat): represents the amount of energy needed to vaporize a unit mass of saturated liquid at a given temperature or pressure. It decreases as the temperature or pressure increase, and becomes zero at the critical point
We will find that the enthalpy h is quite useful in calculating the energy of mass streams flowing into and out of control volumes. The enthalpy is also useful in the energy balance during a constant pressure process for a substance contained in a closed piston-cylinder device. The enthalpy has units of energy per unit mass, kJ/kg. The entropy s is a property defined by the second law of thermodynamics and is related to the heat transfer to a system divided by the system temperature; thus, the entropy has units of energy divided by temperature. -
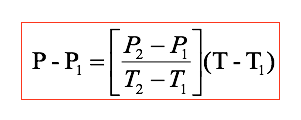
- Saturated Water Tables
- Since temperature and pressure are dependent properties using the phase change, two tables are given for the saturation region. Table A-4 has temperature as the independent property; Table A-5 has pressure as the independent property. For the complete Table A-4 and table A-5, the last entry is the critical point at 220.64 bar and 373.95 oC.
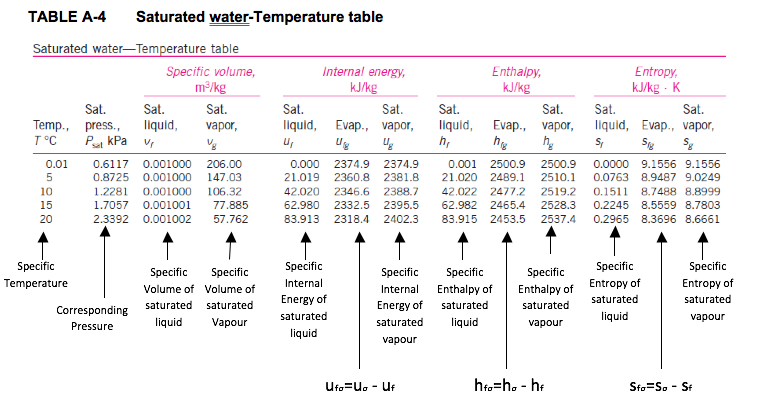
Saturation pressure is the pressure at which the liquid and vapour phases are in equilibrium at a given temperature.
Saturation temperature is the temperature at which the liquid and vapour phases are in equilibrium at a given pressure.
The subscript fg used in Tables A-4 and A-5 refers to the difference between the saturated vapour value and the saturated liquid value region. That is,
ufg = ug - uf
hfg = hg - hf
sfg = sg - sf
The quantity hfg is called the enthalpy of vaporization (or latent heat of vaporization). It represents the amount of energy needed to vaporize a unit of mass of saturated liquid at a given temperature or pressure. It decreases as the temperature or pressure increases, and becomes zero at the critical point. -
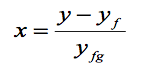
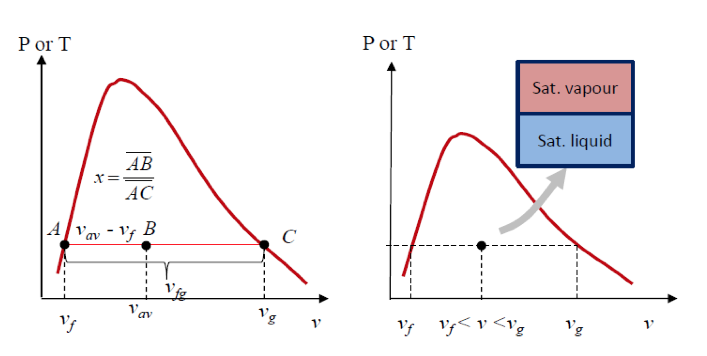
- Quality and Saturated Liquid-Vapour Mixture
- Now, let’s review the constant pressure heat addition process for water shown in Figure 2-3 (page 21). Since state 3 is a mixture of saturated liquid and saturated vapour, how do we locate it on the T-v diagram? To establish the location of state 3 a new parameter called the quality x is defined as:
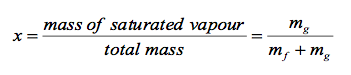
The quality is zero for the saturated liquid and one for the saturated vapour (0 ⋜ x ⋜ 1). The average specific volume at any state 3 is given in terms of the quality as follows. Consider a mixture of saturated liquid and saturated vapour. The liquid has a mass mf and occupies a volume Vf. The vapour has a mass mg and occupies a volume Vg. We note
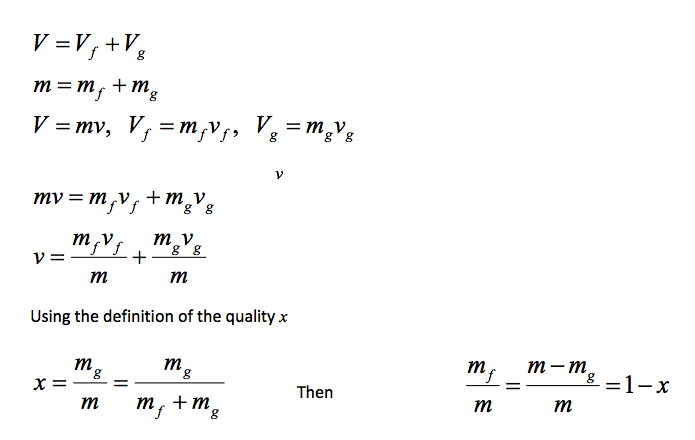
Note, quantity 1- x is often given the name moisture. The specific volume of the saturated mixture becomes
v = (1 - x)Vf + xvg
The form that we use most often is
v = Vf + x(vg - vf)
It is noted that the value of any extensive property per unit mass in the saturation region is calculated from an equation having a form similar to that of the above equation. Let Y be any extensive property and let y be the corresponding intensive property, Y/m, then
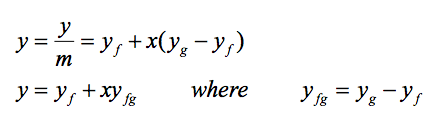
The term yfg is the difference between the saturated vapour and the saturated liquid values of the property y; y may be replaced by any of the variables v, u, h, or s.
We often use the above equation to determine the quality of steam (dryness fraction) x of a saturated liquid-vapour state.
The following application is called the Lever Rule:
The Lever Rule is illustrated in the following figures.
Example: 2-1
A closed, rigid container of volume 0.5 m3 is placed on a hot plate. Initially, the container holds a two-phase mixture of saturated liquid water and saturated water vapour at p1= 1 bar with a quality of 0.5. After heating, the pressure in the container is p2= 1.5 bar. Indicate the initial and final states on a T–v diagram, and determine (a) the temperature, in oC, at each state. (b) the mass of vapour present at each state, in kg. (c) If heating continued, determine the pressure, in bar, when the container holds only saturated vapour.
Assumptions:
1. The water in the container is a closed system.
2. States 1, 2, and 3 are equilibrium states.
3. The volume of the container remains constant.
Analysis:
Two independent properties are required to fix states 1 and 2. At the initial state, the pressure and quality are known. As these are independent, the state is fixed. State 1 is shown on the T–v diagram in the two-phase region. The specific volume at state 1 is found using the quality x= 0.5. That is
From Table A-5 at p1= 1 bar,

At state 2 the pressure is known. Volume and mass remain constant during the heating process within the container, so ν1 = ν2. For P2 = 1.5 bar, tables page 10 gives vf2= 0.1052×10⁻² m3/kg (approximation at 1.433 bar) and vg2= 1.159 m3/kg. Since
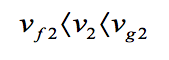
State 2 must be the two-phase region as well. Since state 1 and 2 are in the same two-phase liquid-vapour region, the temperature correspond to the saturation Temperature for the given pressure
Table T-3 gives T1= 99.61°C and T2= 111.35°C
(a) To find the mass of water vapour present, we first use the volume and the specific volume to find the total mass, m. That is
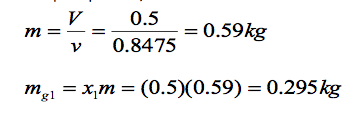
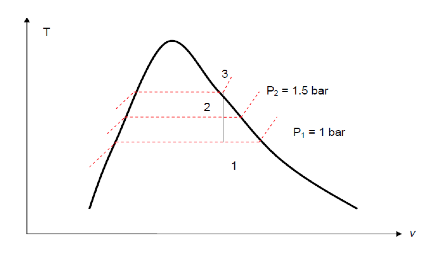
(b) The mass of vapour at state 2 is found similarly using dryness fraction x2. From Tables A- 5 for P2= 1.5 bar, we have:
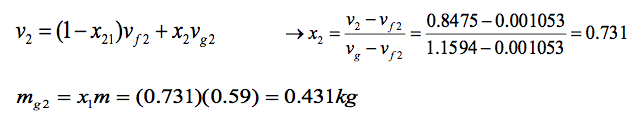
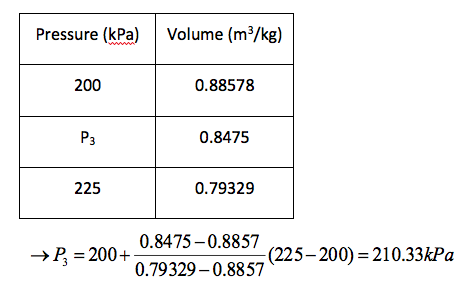
(c) If heating continued, state 3 would be on the saturated vapour line, as shown on the T–v diagram above. Thus, the pressure would be the corresponding saturation pressure to vg = 0.8475 m3 /kg.
Interpolating in Table A-5
-
- Superheated Water Table
- A substance is said to be superheated if the given temperature is greater than the saturation temperature for the given pressure. In the region to the right of the saturated vapour line and at temperatures above the critical point temperature, a substance exists as superheated vapour.
State 5 in Figure 2-3 (page 21) is a superheated state.
In this region, temperature and pressure are independent properties.
In the superheated water Table A-6, T and P are the independent properties. The value of temperature to the right of the pressure is the saturation temperature for the pressure. The first entry in the table is the saturated vapour state at the pressure. The properties are listed against the temperature for selected pressures starting with the saturated vapour data. The saturation temperature is given in parentheses following the pressure value.
Below is a partial listing of Table A–6
Superheated vapour is characterized by:
Lower pressure (P < Psat at a given T)
Higher temperature (T > Tsat at a given P)
Higher specific volumes (v > vg at a given P or T)
Higher internal energies (u > ug at a given P or T)
Higher enthalpies (h > hg at a given P or T) -
- Compressed Liquid Water Table
- A substance is said to be a compressed liquid when the pressure is greater than the saturation pressure for the temperature. It is now noted that state 1 in Figure 2-3 (page 21) is called a compressed liquid state because the saturation pressure for the temperature T1 is less than P1. Data for water compressed liquid states are found in the compressed liquid tables, Table A-7. Table A-7 is arranged like Table A-6, except the saturation states are the saturated liquid states. Note that the data in Table A-7 begins at 5 MPa or 50 times atmospheric pressure. At pressures below 5 MPa for water, the data are approximately equal to the saturated liquid data at the given TEMPERATURE. The properties of a liquid are relatively independent of pressure (incompressible).
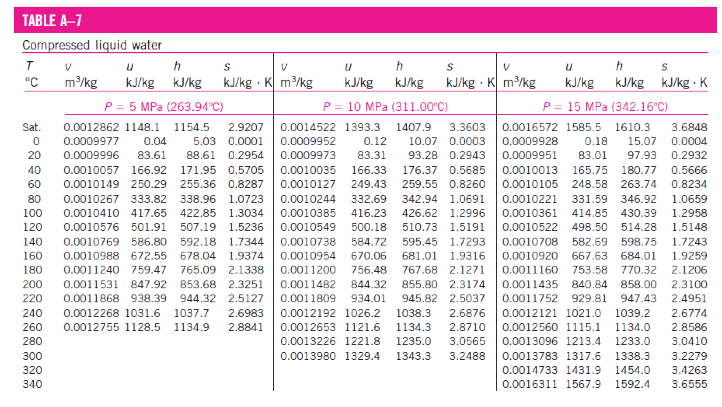
We approximate intensive parameter y, that is v, u, h, and s data as
y ≅ y f@T
The enthalpy is more sensitive to variations in pressure; therefore, at high pressures the enthalpy can be approximated by
h ≅ h f@T + vf(P - Psat)
For our work, the compressed liquid enthalpy may be approximated by
h ≅ h f@T -
- How to Choose the Right Table
- The correct table to use to find the thermodynamic properties of a real substance can always be determined by comparing the known state properties to the properties in the saturation region. Given the temperature or pressure and one other property from the group v, u, h, and s, the following procedure is used. For example if the pressure and specific volume are specified, three questions are asked: For the given pressure,
is v < vf ?
is vf < v < vg?
is v > vg ?
The answer to one of these questions must be yes. If the answer to the first question is yes, the state is in the compressed liquid region, and the compressed liquid tables are used to find the properties of the state. If the answer to the second question is yes, the state is in the saturation region, and either the saturation temperature table or the saturation pressure table is used to find the properties. Then the quality is calculated and is used to calculate the other properties, u, h, and s. If the answer to the third question is yes, the state is in the superheated region and the superheated tables are used to find the other properties.
Some tables may not always give the internal energy. When it is not listed, the internal energy is calculated from the definition of the enthalpy as
]
u = h - Pv -
- Linear interpolation of tabular data
- • Interpolation is often required when exact values are not tabulated.
• In this course we will primarily use linear interpolations.
• Use extrapolations only if there is no other choice.
• Occasionally double interpolations will be necessary.
Single interpolation: The most common interpolation is the single interpolation of variables. We give an example here.
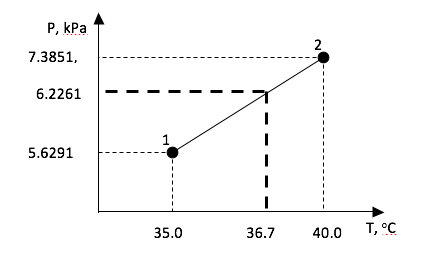
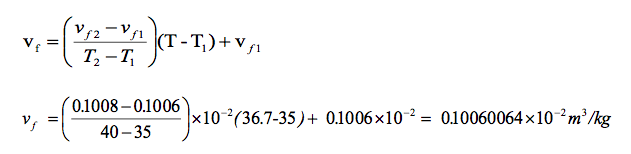
Given steam at T = 36.7 ◦C, with v = 10 m3/kg, find the pressure and the dryness fraction (quality of steam) if a two-phase mixture (wet mixture). A wise first step is to go to the saturated tables. We check Steam Table and find there are no values at T = 36.7 ◦C. So we must create our own personal steam table values at this temperature. We list the important part of the saturated water liquid-vapour tables in steam Table page 2.
We seek to get appropriate values for P, vg, vf, and vfg at T = 36.7 oC. Let us find P first. The essence of linear interpolation is to fit known data to a straight line, then use the formula of that line to predict intermediate values of variables of interest. We know values of P at T = 35oC and T = 40 oC. In fact we have two points: (T1, P1) = (35 oC, 5.6291kPa), and (T2, P2) = (40 oC, 7.3851kPa).
This lets us fit a line using the familiar point-slope formula:
We could have used the other point. Note when T = T1, that P = P1. Also, when T = T2, P = P2.
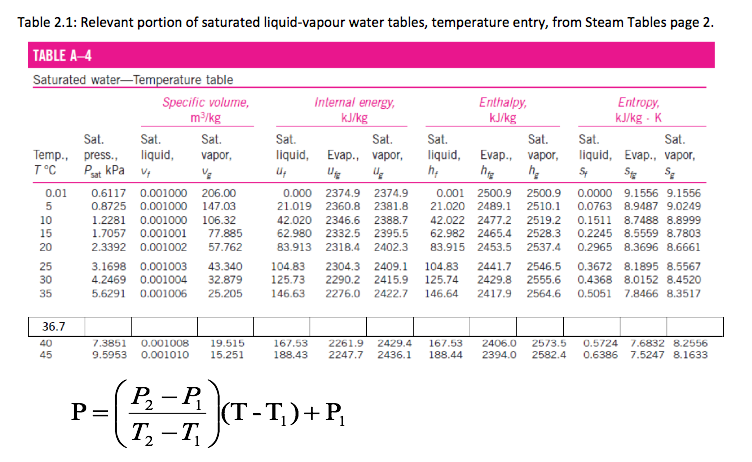
Substituting numbers, we get
P = (\frac{7.3851 - 5.6291}{40 - 35})(36.7 - 35) + 5.6291 = 6.22614kPa
The interpolation is sketched in Figure below.
Now, we need to interpolate for vg and vf as well. Let us apply the same technique. For vg, we have
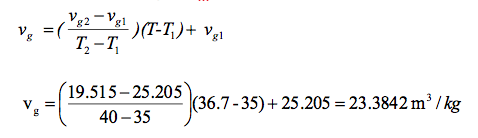
Apply the same interpolation technique for to determine vf using the data provided in steam table A-4 (above).This lets us fit a line using the familiar point-slope formula:
Knowing vf and vg, we do not need to interpolate for vfg. We can simply use the definition:
vfg = (vg - vf) = (23.3842 - 0.10060064 x 10⁻²) = 23.38139m3/kg
Now v = 10 m3/kg. Since at T = 36.7oC, we have vf < v < vg, thus the steam is a two-phase mixture (wet mixture). Let us get the dryness fraction (quality of steam). From the following equation:
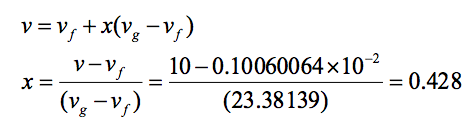
Important: For practice you can determine the rest of the missing value in above Table A-4 corresponding to 36.7 oC (ie. hf, hfg, hg, sf, sfg, and sg) -
- Self Assessment Exercises
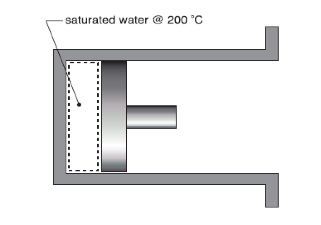 Self-Assessment (1-1):
Initially saturated water at 200o C is contained in a piston-cylinder device as shown below. The water is then heated isothermally until its volume is 100 times larger than its initial volume.
a) Determine the increase in internal energy [kJ/kg] of the water
b) Determine the work transfer [kJ/kg] and indicate whether it is into or out of the water.
c) Determine the heat transfer [kJ/kg] and indicate whether it is into or out the water.
[Ans: (a) 1583.44 kJ/kg; (b) −177.98 kJ/kg; (c) 1761.42 kJ/kg] -
- STEAM TABLES - Tutorials
- Q1. Using your Thermodynamic Properties of Fluids Tables, determine.
a. The specific enthalpy of:
i. Saturated water at a temperature of 130oC,
ii. Dry saturated steam at a temperature of 130oC.
b. The saturated water pressure, and the dry saturated steam pressure at 130oC.
c. The specific volume of dry saturated steam at a pressure of 2.75bar.
d. The specific enthalpy of steam at a pressure of 2.75 bar and a dryness fraction of 0.9.
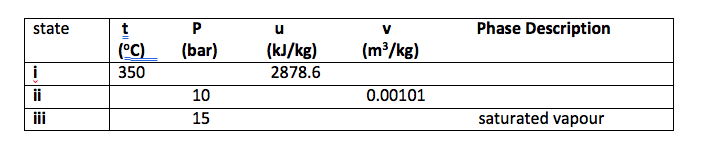
Q2. Using water as the working fluid, complete the table shown below. For each case, show all calculations necessary to establish the unknown property values of the state point. Identify the relevant tables used to perform your calculations.
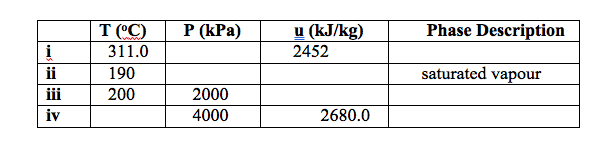
Q3. Determine the missing properties and the phase description for water in Table below, showing all working procedures.
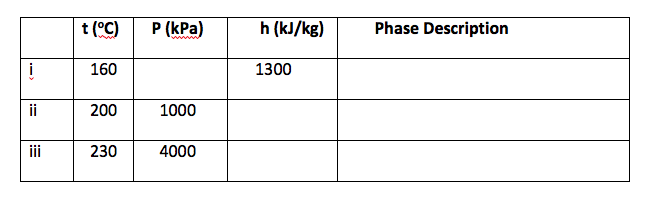
Q4 Determine the missing properties and the phase description for water in Table below, showing all working procedures.
Q5. Water is to be boiled at sea level (1.0142bar) in a 300 mm diameter stainless steel pan placed on top of a 3kW electric burner. Given that 60% of the heat generated by the burner is transferred to the water during boiling, determine the rate of evaporation of water.
(Ans: 2.781kg/h )
Q6. A rigid tank with a volume of 1.9 m3 contains 15 kg of saturated liquid–vapour mixture of water at 75°C. Now the water is slowly heated. Determine the temperature at which the liquid in the tank is completely vaporized. Also, show the process on a T-v diagram with respect to saturation lines. (Ans: 200.0oC )
Q7. A piston–cylinder device initially at 1000 kPa and contains 1 m3 of saturated liquid and saturated vapour mixture in equilibrium at the ratio of 3 : 7 of saturated liquid to saturated vapour respectively. Heat is added at constant pressure until the temperature reaches 600°C.
a: Determine:
i. the initial temperature of the water;
ii. the total mass of the water;
iii. the final volume.
b: Show the process on a P-v diagram with respect to saturation lines.
(Ans: 179.88°C ; 269.79kg; 108.22 m3 )
Q8. A 0.3m3 rigid vessel initially contains saturated liquid–vapour mixture of water at 170°C. The water is now heated until it reaches the critical state. Determine the mass of the liquid water and the volume occupied by the liquid at the initial state.
(Ans:95.79kg; 0.10671 m3)
Q9. A piston–cylinder device initially contains steam at 3.5 MPa, superheated by 5°C. Now, steam loses heat to the surroundings and the piston moves down hitting a set of stops at which point the cylinder contains saturated liquid water. The cooling continues until the cylinder contains water at 200°C.
Determine:
i. the initial temperature, (Ans: 247.6°C)
ii the enthalpy change per unit mass of the steam by the time the piston first hits the stops (Ans: -1771.3kJ/kg )
iii. the final pressure and the quality (if mixture).(Ans: P3 = 1555 kPa and x3 = 0.0006)
Q10. The radiator of a steam heating system has a volume of 20 L and is filled with superheated water vapour at 300 kPa and 150°C. At this moment both the inlet and exit valves to the radiator are closed. After a while the temperature of the steam drops to 40°C as a result of heat transfer to the air in the room. Determine the entropy change (ΔS) of the steam during this process in kJ/K. (-0.1974kJ/K) -
- right
- left
-
- right