07
-
Welcome to this section of the Energy Resources, Generation & Utilisation module.
- Guidance of study for Week 7
(i) Please view the video, “Shock and Awe” within the “videos” folder of GCU learn. This video is in 3 parts, each one hour long. It is advised to watch this in 3 sessions. Do not watch all at the one sitting.
In this three-part, BBC Horizon documentary physicist and science communicator Jim Al-Khalili takes the viewer on a journey exploring the most important historical developments in electricity and magnetism. This documentary discusses how the physics (and the people behind the physics) changed the world forever.
Part 1 - Spark
Part 2 - The Age of Invention
Part 3 - Revelations and Revolutions
I hope watching this video will inspire you all, in your chosen vocation of electrical power engineering.
(ii) Please review 7.1 to 7.8 inclusive and the reference notes for this week 7 is taken from Chapter 39, “Electrical Energy Systems”. Also contained within the folder, ”Learning Resources” of GCU learn.
(iii) “Quiz No: 1 Our Environment” is available within the “Quizzes” folder of GCU learn. Use of the internet is permissible in answering these multiple choice questions.
(iv) HOMEWORK: - Task 1 and Task 2 should now be attempted. Each Task has 4 exercises. You are to complete all of the 4 exercises, but to only submit 2 (Max 2 pages in length) to your tutor for marking / feedback.
(v) HOMEWORK: - All Contextualised questions are to be answered and submitted to your tutor for marking / feedback.
(vi) Tutorial questions to be attempted.
Any problems / questions. Please contact your tutor - Guidance of study for Week 7
-
- When you have studied this course, you should:
- understand energy units and their manipulation
- be familiar with the topic of energy conversion
- be familiar with the topic of bulk electricity supply
- understand load-forecasting and load-matching issues
- understand electricity generation from coal and gas
- understand the principles of nuclear fission power plant
- understand the principles of sustainable electricity generation; from several renewable energies; wind, wave, tidal, solar energy and biomass
- appreciate the topic of distributed/embedded generation
- the costs involved in the generating of electricity
Introduction:
- The main section of this topic is the discussion of energy conversion to electricity from sustainable and non-sustainable sources of energy. After an introduction to the principles of energy conversion, the topic of bulk electricity supply will be described.
- Electricity is a commodity which has to be made as it is required, so supply has to be matched to demand at any instant. Thus the importance of load forecasting is highlighted, as is the use of pumped storage plant to meet sudden surges in demand.
- The inefficiencies of energy conversion both to and from electrical energy should be recognised – they are relevant to both the generation and the use of electricity.
- In particular, the generation of electricity in large thermal stations is less than 40 per cent efficient, such that, coupled with transmission losses, little more than one-third of the energy input to such stations reaches consumers as electrical energy. The use of combined heat and power stations can mitigate such inefficiency to some extent.
World Electricity
- Over 80 per cent of the world’s electricity is generated from fossil fuels or by nuclear fission, so the advantages and disadvantages of electricity generation in coal, gas and nuclear power stations will be discussed.
- These ‘conventional’ generation methods and ‘renewable’ electricity generation techniques can therefore be compared.
- Of the latter, hydroelectricity supplies over 16 per cent of worldwide electricity demand, much of other renewables technology is in its infancy.
- Nonetheless, the need both to conserve the reserves of fossil fuels and to reduce carbon dioxide emissions is leading to rapid developments in these techniques, for example in wind, wave and solar photovoltaic electricity generation, and such techniques are therefore discussed here. The cost of generating electricity from different sources is also discussed.
-
Units of Energy
- The SI unit of energy is the joule (J).
1 kJ kilojoule 103J 1 MJ megajoule 106J 1 GJ gigajoule 109J 1 TJ terajoule 1012J 1 PJ petajoule 1015J 1 EJ exajoule 1018J - Much of our energy consumption is based on the burning of fossil fuels, the quality of which varies, so values of energy content of coal or oil are approximate. They are usually given in tonnes of oil equivalent (toe or Mtoe).
- 1 ~ toe = 42 GJ
- For example, the worldwide energy consumption in 2016 was estimated to have been 14 500 million tonnes of oil
- 🔗 https://en.wikipedia.org/wiki/World_energy_consumption
- 14500 ~ Mtoe = 14500 \times 10^6 \times 42 \times 10^9J = 609 EJ
- UK consumption of primary energy in 2016 was 194~ Mtoe~ (= 8.15 EJ).
- Electrical energy is more usually calculated in kilowatt hours (kW h) since the rate of energy consumption is the watt ( W), a joule per second ( J/s).
- 1 ~ kW~h = 3600 kJ = 3.6 MJ
- In 2016, worldwide electricity generation was approximately 24 \times 106 ~ GW h and UK generation about 500 000 ~d GW h.
Video: World Energy Outlook 2016
- 📹 http://www.iea.org/newsroom/news/2016/november/world-energy-outlook-2016.html
Forms of Energy
Energy comes in several forms.
- 1. Gravitational potential (add)
- Energy = mass × gravitational acceleration × height
- E = mgh
- Example: stored energy in a reservoir.
- 2. Mechanical. Kinetic energy (KE) of a moving object.
- Energy = 0.5 (mass \times velocity^2)
- ^2E = 0.5 ~e mv^2
- Examples: flow of water to a turbine; flow of air though wind turbine blades;
- 3. Thermal. The energy ‘stored’ as heat in a body (of gas or liquid for example):
- Energy = mass \times specific~heat \times rise ~ in ~ temperature
- Energy is mainly due to an increase in kinetic energy of atoms/ molecules.
- Examples: heat from burning fossil fuels or from a nuclear reaction; heat from solar thermal collector.
- 4. Chemical. Energy released in chemical reaction.
- Example: burning of fuel – often given in kJ/kg.
- 5. Electrical. The energy in joules is given by the product of power (P = VI~ watts)~ and~ time (s).
- E = power \times time (Note:~ 1 J =1 W s.)
- Small quantities of energy may be stored in a battery.
- Electricity generation must balance demand second by second.
- 6. Radiation.
- Examples: solar photovoltaic (pv) conversion to electricity; photosynthesis of sunlight to biomass.
- Atomic energy may also be included in this list, where mass (m) is converted to energy in a nuclear reactor. Energy is released
- E = mc^2
- c is the speed of light
-
Conversion of Energy
- Energy is not consumed, but converted from one form to another. This is the Law of Conservation of Energy embodied in the First Law of Thermodynamics. Most of the electrical and mechanical energy and the heat used in our homes, offices and factories is generated from fossil fuels
- – oil, coal and natural gas. Chemical energy is being converted.
- Part of our electrical energy comes from hydroelectric stations where gravitational potential energy is being converted. Part also comes from nuclear power stations where energy stored in atomic nuclei is converted.
Conversion of Energy
- The above can be illustrated by considering the car. The car engine burns fuel, delivering mechanical energy to propel the car. It is an inefficient process. About 80 per cent of the energy becomes waste heat immediately, releasing thermal energy with the exhaust gases. Only about 20 per cent of the chemical energy of the fuel becomes mechanical energy, some of which becomes electrical energy for instrumentation, motors etc. Much of the mechanical energy ends up as frictional losses – thermal energy which is dissipated into the environment.
- The poor efficiency of the engine is partly because of the Second Law of Thermodynamics, which states that the perfect heat engine is impossible. The efficiency of an ideal heat engine is:
- \text{Efficiency} ~1 = \frac{T2}{T1}
- Where T1 is the temperature of the heat source (the hot gas produced by fuel combustion in the car) and T2 is the surrounding air temperature. Both temperatures have to be expressed in kelvin (273 + °C).
- For a car, T1 = 2400 K and T2 = 300 K and so
- \text{Efficiency} ~1 = \frac{300}{2400} = 0.88
- In fact, the efficiency of a car engine falls well short of this maximum theoretical value.
- Similar principles apply to the steam turbine in a power station. For a power station turbine, T1 = 600 °C and T2 = 45 °C, and so
- \text{Efficiency} ~1 = \frac{318}{873} = 0.64
- Power station turbines do not reach this theoretical limit. the heat to mechanical energy conversion efficiency of a modern power station turbine is about 0.5 (50 per cent).
- A consequence, therefore, of making more useful energy (mechanical or electrical energy, for example) is less useful energy (thermal energy). The concept of useful energy as ‘ordered’ energy and less useful energy as ‘disordered’ energy is helpful. Kinetic and potential energy of ‘bodies’ are the most ordered forms of energy. They are said to have least entropy. Disordered energy has higher entropy. Energy of low entropy can be totally converted into energy of higher entropy so the gravitational potential energy of water in a reservoir can, in principle, be converted into an equal amount of mechanical or electrical energy. Hydroelectric stations are very efficient – about 85 per cent – in practice. Energy of higher entropy (more disorder) can only be partly converted into energy of lower entropy since to satisfy the Second Law of Thermodynamics some of the energy must be con- verted to energy of even higher entropy. Burning fuel in a car to produce mechanical energy (of low entropy) inevitably produces waste heat (of high entropy).
- The efficiencies of energy conversion in practice are well below the limits set by thermodynamics.
-
Electricity network
- The UK supply network is typical of many industrialized countries, elec- tricity being supplied from many large power stations usually generating at (three-phase r.m.s. line to line) voltages up to 25 kV. Power is transmitted at high voltage (400, 275 and 132 kV) over long distances to minimize trans- mission losses, at medium voltage (33 and 11 kV) over shorter distances, and to supply consumers locally at low voltage (415 V (three-phase) or 240 V (single-phase)). Some large industrial and commercial consumers receive supplies at 11 kV and 33 kV.
- The National Grid operates the high-voltage transmission system in England, Scotland and Wales linking generators to distributors and some large customers. This transmission system is linked to the transmission sys- tem of continental Europe via a 2000 MW capacity interconnector to France under the English Channel. Thus a single Great Britain market has been created and the transmission network is regarded as a single system.
- 📹 National Grid UK
- 📹 National Grid Africa
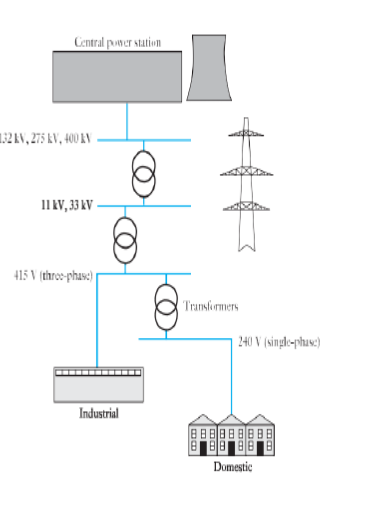
- Simplified power system diagram
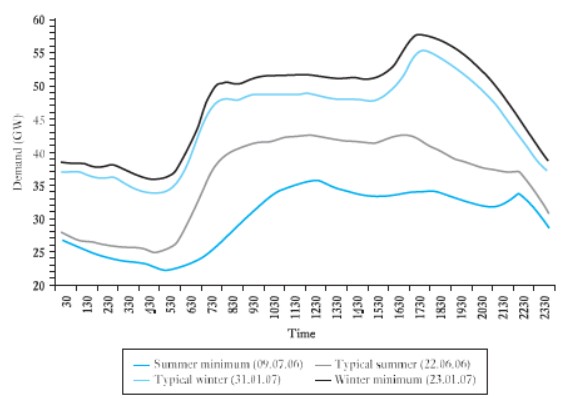
- UK Summer and winter electricity demand profiles
Load forecasting and load matching
- Demand for electricity changes dramatically by the minute, by the time of day, and from summer to winter. The average demand is around 40 GW, but the peak demand in winter is nearly 60 GW and the minimum summer night demand is 22 GW. This latter demand is termed the base load which, in effect, can be considered as a continuous demand on the system throughout the year, upon which a varying demand occurs. In Great Britain the highest ever load met was 60 118 MW on 10 December 2002.
- Electricity is a commodity that has to be made as it is required – supply has to match demand at any instant. As customers demand more power, more must be generated to meet that demand. Sources of that electrical power must also be optimized to deliver that supply. A competitive market exists in which suppliers of electricity compete to sell electricity to a central ‘power pool’. Electricity thus bought at the lowest available price at a particular time is then distributed through the National Grid to consumers. In general, power stations with the lowest running costs supply the base load. In the UK, these are typically a mix of nuclear, large-coal and gas-fired stations. Night-time demand in summer can be very low, so prices are correspond- ingly low. As demand increases, so stations with higher costs bid into the pool and electricity prices rise. Similar ‘power pools’ exist in other countries. It should be noted though that many factors bear on the operation and optimization of an electricity supply system and now include such factors as anti-pollution legislation and resultant ‘carbon emissions taxes’ which pro- mote the use of renewable forms of energy to generate electricity. The use of particular fuels, nuclear, coal, gas or oil, is not always left to the ‘free market’ either since there may be strategic ‘national’ issues to take into account. The role of nuclear power in a low-carbon-generation strategy is widely discussed.
Fuel MW Conventional steam 37 254 Combined cycle gas turbine 27 059 Nuclear 10 969 Gas turbine and oil 1 444 Hydro, natural flow 1 424 Hydro, pump storage 2 726 Other renewables 2 169 Total Installed Capacity 83 045 - Matching supply and demand is complex. Detailed load forecasting is essential and entails:
- 1. detailed weather forecasting, particularly the effect of wind on the effective temperature;
- 2. effect of TV programmes, particularly commercial breaks and the mid- point and end of large sporting events;
- 3. day-to-day variations due to work patterns, weekends, and so on.
- Generators must be controlled so that the input power – for example from steam supplied to a turbine/generator set or water to a hydro-generator – exactly matches the output power demand. If insufficient steam or water is supplied, the generator slows down and the frequency falls. A further con- sideration is that it can take many hours, from cold, for a large 660 MW steam turbine/generator set to be prepared to deliver full power. A turbine expands between cold and hot and heating can take place only slowly.
kg per kWh of
electricity generatedCoal 1.0 Combined cycle gas turbine 0.5 Nuclear 0.05 XX -
Generating Plant
- This section describes electricity generating plant, and covers generation both by conventional technology and by the new renewable sources of electricity that are being developed to reduce carbon dioxide emissions and, at least as importantly, to reduce the rate at which fossil fuels are being used.
- A study of conventional electricity generation is needed to provide the context for the renewable sources which might replace them, such is the vast scale on which electricity is generated worldwide.
Electricity Generation
- Electricity generation is the process of generating electric power from sources of primary energy. For electric utilities, it is the first process in the delivery of electricity to consumers. The other processes as transmission, distribution, energy storage and recovery using pumped-storage methods are normally carried out by the electric power industry. Electricity is most often generated at a power station by electromechanical generators, primarily driven by heat engines fuelled by combustion or nuclear fission but also by other means such as the kinetic energy of flowing water and wind. Other energy sources include solar photovoltaics and geothermal power.
History
- The fundamental principles of electricity generation were discovered during the 1820s and early 1830s by the British scientist Michael Faraday. This method is still used today: electricity is generated by the movement of a loop of wire, or disc of copper between the poles of a magnet. Central power stations became economically practical with the development of alternating current power transmission, using power transformers to transmit power at high voltage and with low loss.
- Electricity has been generated at central stations since 1882. The first power plants were run on water power or coal, and today rely mainly on coal, nuclear, natural gas, hydroelectric, wind generators, and petroleum, with supplementary amounts from solar energy, tidal power, and geothermal sources. The use of power-lines and powerpoles have been significantly important in the distribution of electricity.

- Electric generators transform kinetic energy into electricity. This is the most used form for generating electricity and is based on Faraday’s law. It can be seen experimentally by rotating a magnet within closed loops of a conducting material (e.g. copper wire). Almost all commercial electrical generation is done using electromagnetic induction, in which mechanical energy forces a generator to rotate.
- Types of Power stations and Generating Equipment
- Coal fired power plants are a type of power plant that make use of the combustion of coal in order to generate electricity. Their use provides around 40% of the world's electricity and they are primarily used in developing countries. Countries such as South Africa use coal for 94% of their electricity and China and India use coal for 70-75% of their electricity needs, however the amount of coal China uses dwarfs most other countries. The use of coal provides access to electricity to those who previously didn't have it, which helps to increase quality of life and reduce poverty in those regions, however it produces large quantities of different pollutants which reduces air quality and contributes to climate change.
- 🔗 Coal fired power plant
- 📹 Drax Power Station video
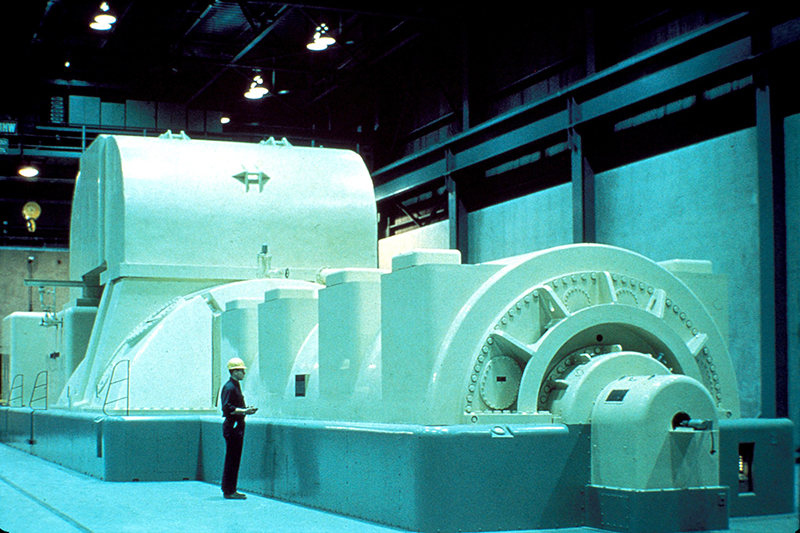
- Almost all commercial electrical power on Earth is generated with a turbine, driven by wind, water, steam or burning gas. The turbine drives a generator, thus transforming its mechanical energy into electrical energy by electromagnetic induction. There are many different methods of developing mechanical energy, including heat engines, hydro, wind and tidal power. Most electric generation is driven by heat engines. The combustion of fossil fuels supplies most of the energy to these engines, with a significant fraction from nuclear fission and some from renewable sources. The modern steam turbine (invented by Sir Charles Parsons in 1884) currently generates about 80% of the electric power in the world using a variety of heat sources.
- Turbine types include:
- Steam
- Water is boiled by coal burned in a thermal power plant, about 41% of all electricity is generated this way.
- Nuclear fission heat created in a nuclear reactor creates steam. Less than 15% of electricity is generated this way.
- 📹 How Nuclear Power Plants work
- 📹 Tour of Nuclear Power Plant
- Renewables. The steam is generated by Biomass, Solar thermal energy where solar parabolic troughs and solar power towers concentrate sunlight to heat a heat transfer fluid, which is then used to produce steam, or Geothermal power.
- 📹 Solar Power Plant
- 📹 Biomass power plant
- Natural gas: turbines are driven directly by gases produced by combustion. Combined cycle are driven by both steam and natural gas. They generate power by burning natural gas in a gas turbine and use residual heat to generate steam. At least 20% of the world’s electricity is generated by natural gas.
- 📹 Gas thermal power plant: how does a combined cycle work?
- Water Energy is captured from the movement of water. From falling water, the rise and fall of tides or ocean thermal currents. Each driving a water turbine to produce approximately 16% of the world’s electricity.
- 📹 hydropower plant how it works
- The windmill was a very early wind turbine. In a solar updraft tower wind is artificially produced. Before 2010 less than 2% of the worlds electricity was produced from wind.
- 📹 How wind turbines work
- Although turbines are most common in commercial power generation, smaller generators can be powered by gasoline or diesel engines. These may be used for back up generation or isolated villages.
Summary
- Generation can be divided into thermal and non-thermal sources of electricity. Thermal sources typically raise steam to drive turbine/generator sets. Conventional thermal stations burn fossil fuels such as coal to convert water into steam, which then powers steam turbines. Nuclear stations are also steam stations but the heat needed to produce the steam comes from nuclear fission. Combined cycle gas turbine (CCGT) stations combine, in the same plant, gas turbines and steam turbines connected to one or more electrical generators. This enables electricity to be produced at higher efficiencies than is otherwise possible when either gas or steam turbines are used in isolation.
- Hydroelectric stations use natural water flows to turn turbines. Pumped storage hydroelectric stations use electricity to pump water into a high-level reservoir. This water is then released to generate electricity at peak times.
- Other plant includes wind turbines and biomass stations burning fuels such as landfill gas, sewage sludge, and waste. These are renewable sources of electricity. Generation of electricity from the tides, from ocean waves and from solar photovoltaic cells is also possible and will be discussed later.
XXXXXXXX -
Smart Grid
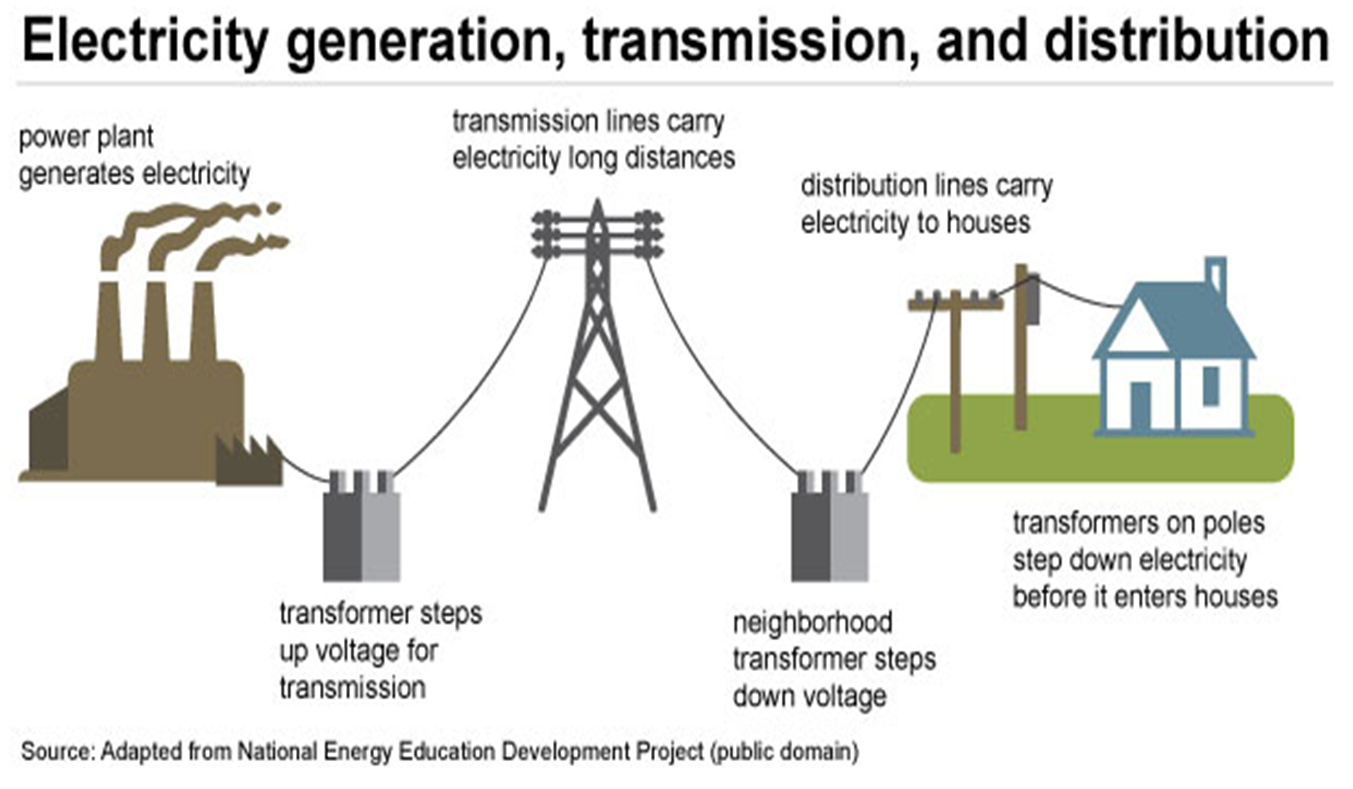
- As stated previously, "The grid," refers to the electric grid, a network of transmission lines, substations, transformers and more that deliver electricity from the power plant to your home or business.
- It’s what you plug into when you switch on your light switch or power up your computer. Our current electric grid was built in the 1890s and improved upon as technology advanced through each decade. Today, it consists of tens of thousands electric generating units with several million megawatts of generating capacity connected worldwide of transmission lines. Although the electric grid is considered an engineering marvel, we are stretching its patchwork nature to its capacity. To move forward, we need a new kind of electric grid, one that is built from the bottom up to handle the digital and computerised equipment and technology dependent on it—and one that can automate and manage the increasing complexity and needs of electricity in the 21st Century.
What Makes a Grid “Smart?”
- In short, the digital technology that allows for two-way communication between the utility and its customers, and the sensing along the transmission lines is what makes the grid smart. Like the Internet, the Smart Grid will consist of controls, computers, automation, and new technologies and equipment working together, but in this case, these technologies will work with the electrical grid to respond digitally to our quickly changing electric demand.
What does a Smart Grid do?
- The Smart Grid represents an unprecedented opportunity to move the energy industry into a new era of reliability, availability, and efficiency that will contribute to our economic and environmental health. During the transition period, it will be critical to carry out testing, technology improvements, consumer education, development of standards and regulations, and information sharing between projects to ensure that the benefits we envision from the Smart Grid become a reality. The benefits associated with the Smart Grid include:
- More efficient transmission of electricity
- Quicker restoration of electricity after power disturbances
- Reduced operations and management costs for utilities, and ultimately lower power costs for consumers
- Reduced peak demand, which will also help lower electricity rates
- Increased integration of large-scale renewable energy systems
- Better integration of customer-owner power generation systems, including renewable energy systems
- Improved security
- Today, an electricity disruption such as a blackout can have a domino effect—a series of failures that can affect banking, communications, traffic, and security. This is a particular threat in the winter, when homeowners can be left without heat.
- 📹 News on the Blackout of 2003
- A smarter grid will add resiliency to our electric power System and make it better prepared to address emergencies such as severe storms, earthquakes, large solar flares, and terrorist attacks. Since it is a two-way interactive capacity, the Smart Grid will allow for automatic rerouting when equipment fails or outages occur.
- This will minimize outages and minimize the effects when they do happen. When a power outage does occur, Smart Grid technologies will detect and isolate the outages, containing them before they become large-scale blackouts. The new technologies will also help ensure that electricity recovery resumes quickly and strategically after an emergency — routing electricity to emergency services first, for example.
- In addition, the Smart Grid will take greater advantage of customer-owned power generators to produce power when it is not available from utilities. By combining these "distributed generation" resources, a community could keep its health center, police,fire, traffic lights,telephone System, and grocery stores operating during emergencies.
- In addition, the Smart Grid is a way to address an aging energy infrastructure that needs to be upgraded or replaced. It’s a way to address energy efficiency, to bring increased awareness to consumers about the connection between electricity use and the environment and it’s a way to bring increased national security to our energy System—drawing on greater amounts of home-grown electricity that is more resistant to natural disasters and attack.
- 📹 What is the smart grid? - by Scientific American
European Smart Grid
- The European super grid is a possible future super grid that would ultimately interconnect the various European countries and the regions around Europe's borders – including North Africa, Kazakhstan, and Turkey – with a high-voltage direct current (HVDC) power grid.
- It is envisaged that a European super grid would:
- lower the cost of power in all participating countries by allowing the entire region to share the most efficient power plants;
- pool load variability and power station unreliability,
- reducing the margin of inefficient spinning reserve and standby that have to be supplied;
- allow for wider use of renewable energy, particularly wind energy, from the concept that "it is always windy somewhere" – in particular it tends to be windy in the summer in North Africa, and windy in the winter in Europe;
- allow wide sharing of the total European hydro power resource, which is about 6 weeks of full load European output; significantly increase the use of 'renewables'; decrease Europe's dependence of imported fuels
- A number of specific schemes have been proposed to create super grids of varying extent within Europe. These include:
- Baltic Energy Market Interconnection Plan involving Denmark, Estonia, Finland, Germany, Latvia, Lithuania, Poland, Sweden and Norway.
- Europagrid, proposed by Europagrid Limited to link various European countries including the United Kingdom, Ireland, Netherlands, Belgium, Germany and Norway.
- North Sea Offshore Grid, an active proposal by the European Commission, first proposed in November 2008 as a building block towards a Europe-wide super grid involving Germany, the United Kingdom, France, Denmark, Sweden, the Netherlands, Belgium, Ireland and Luxembourg.
- Low Grid, proposed by Greenpeace to link the countries of Central Europe, particularly Germany, the Netherlands, Belgium and France.
- High Grid, proposed by Greenpeace to link Europe and North Africa, emphasising the installation of solar power in the South of Europe.
- ISLES, an active proposal, at feasibility stage as of September 2011, to link Scotland, Northern Ireland and Ireland with off-shore renewable energy generation.
- The All Islands Approach, based on cooperation between the countries of the British Isles.
- EU PowerNet. Supergrid to be owned by a cooperative company, owned and governed by the 'national TSO's' of participating European States. The concept recognises the national sovereignty of those States while realising 'direct interconnectors' between all TSO-networks instead of only between neighbours.
- 📹 The Supergrid
- Giving Consumers Control
- The Smart Grid is not just about utilities and technologies; it is about giving you the information and tools you need to make choices about your energy use. If you already manage activities such as personal banking from your home computer, imagine managing your electricity in a similar way. A smarter grid will enable an unprecedented level of consumer participation.
- For example, you will no longer have to wait for your monthly statement to know how much electricity you use. With a smarter grid, you can have a clear and timely picture of it. "Smart meters," and other mechanisms, will allow you to see how much electricity you use, when you use it, and its cost. Combined with real-time pricing, this will allow you to save money by using less power when electricity is most expensive. While the potential benefits of the Smart Grid are usually discussed in terms of economics, national security, and renewable energy goals, the Smart Grid has the potential to help you save money by helping you to manage your electricity use and choose the best times to purchase electricity.
- Building and Testing the Smart Grid
- The Smart Grid will consist of millions of components —controls, computers, power lines, and new technologies and equipment. It will take some time for all the technologies to be perfected, equipment installed, and systems tested before it comes fully on line.
- It will not happen at once as the Smart Grid is continually evolving, over the next decade or so. Once mature, the Smart Grid will likely bring the same kind of transformation that the Internet has already brought to the way we live, work, play, and learn.
- 📹 The Power of the Smart Grid
XXXX -
Introduction to Power Distribution
- A typical electrical power network is illustrated below.
- An electrical network initiates at the point of generation. Electrical power is generated by converting the potential energy available in certain materials into electrical energy. This is either done by direct conversion of kinetic energy, e.g. wind- or water turbines, or creating steam to drive the turbines, e.g. coal- or nuclear boilers.
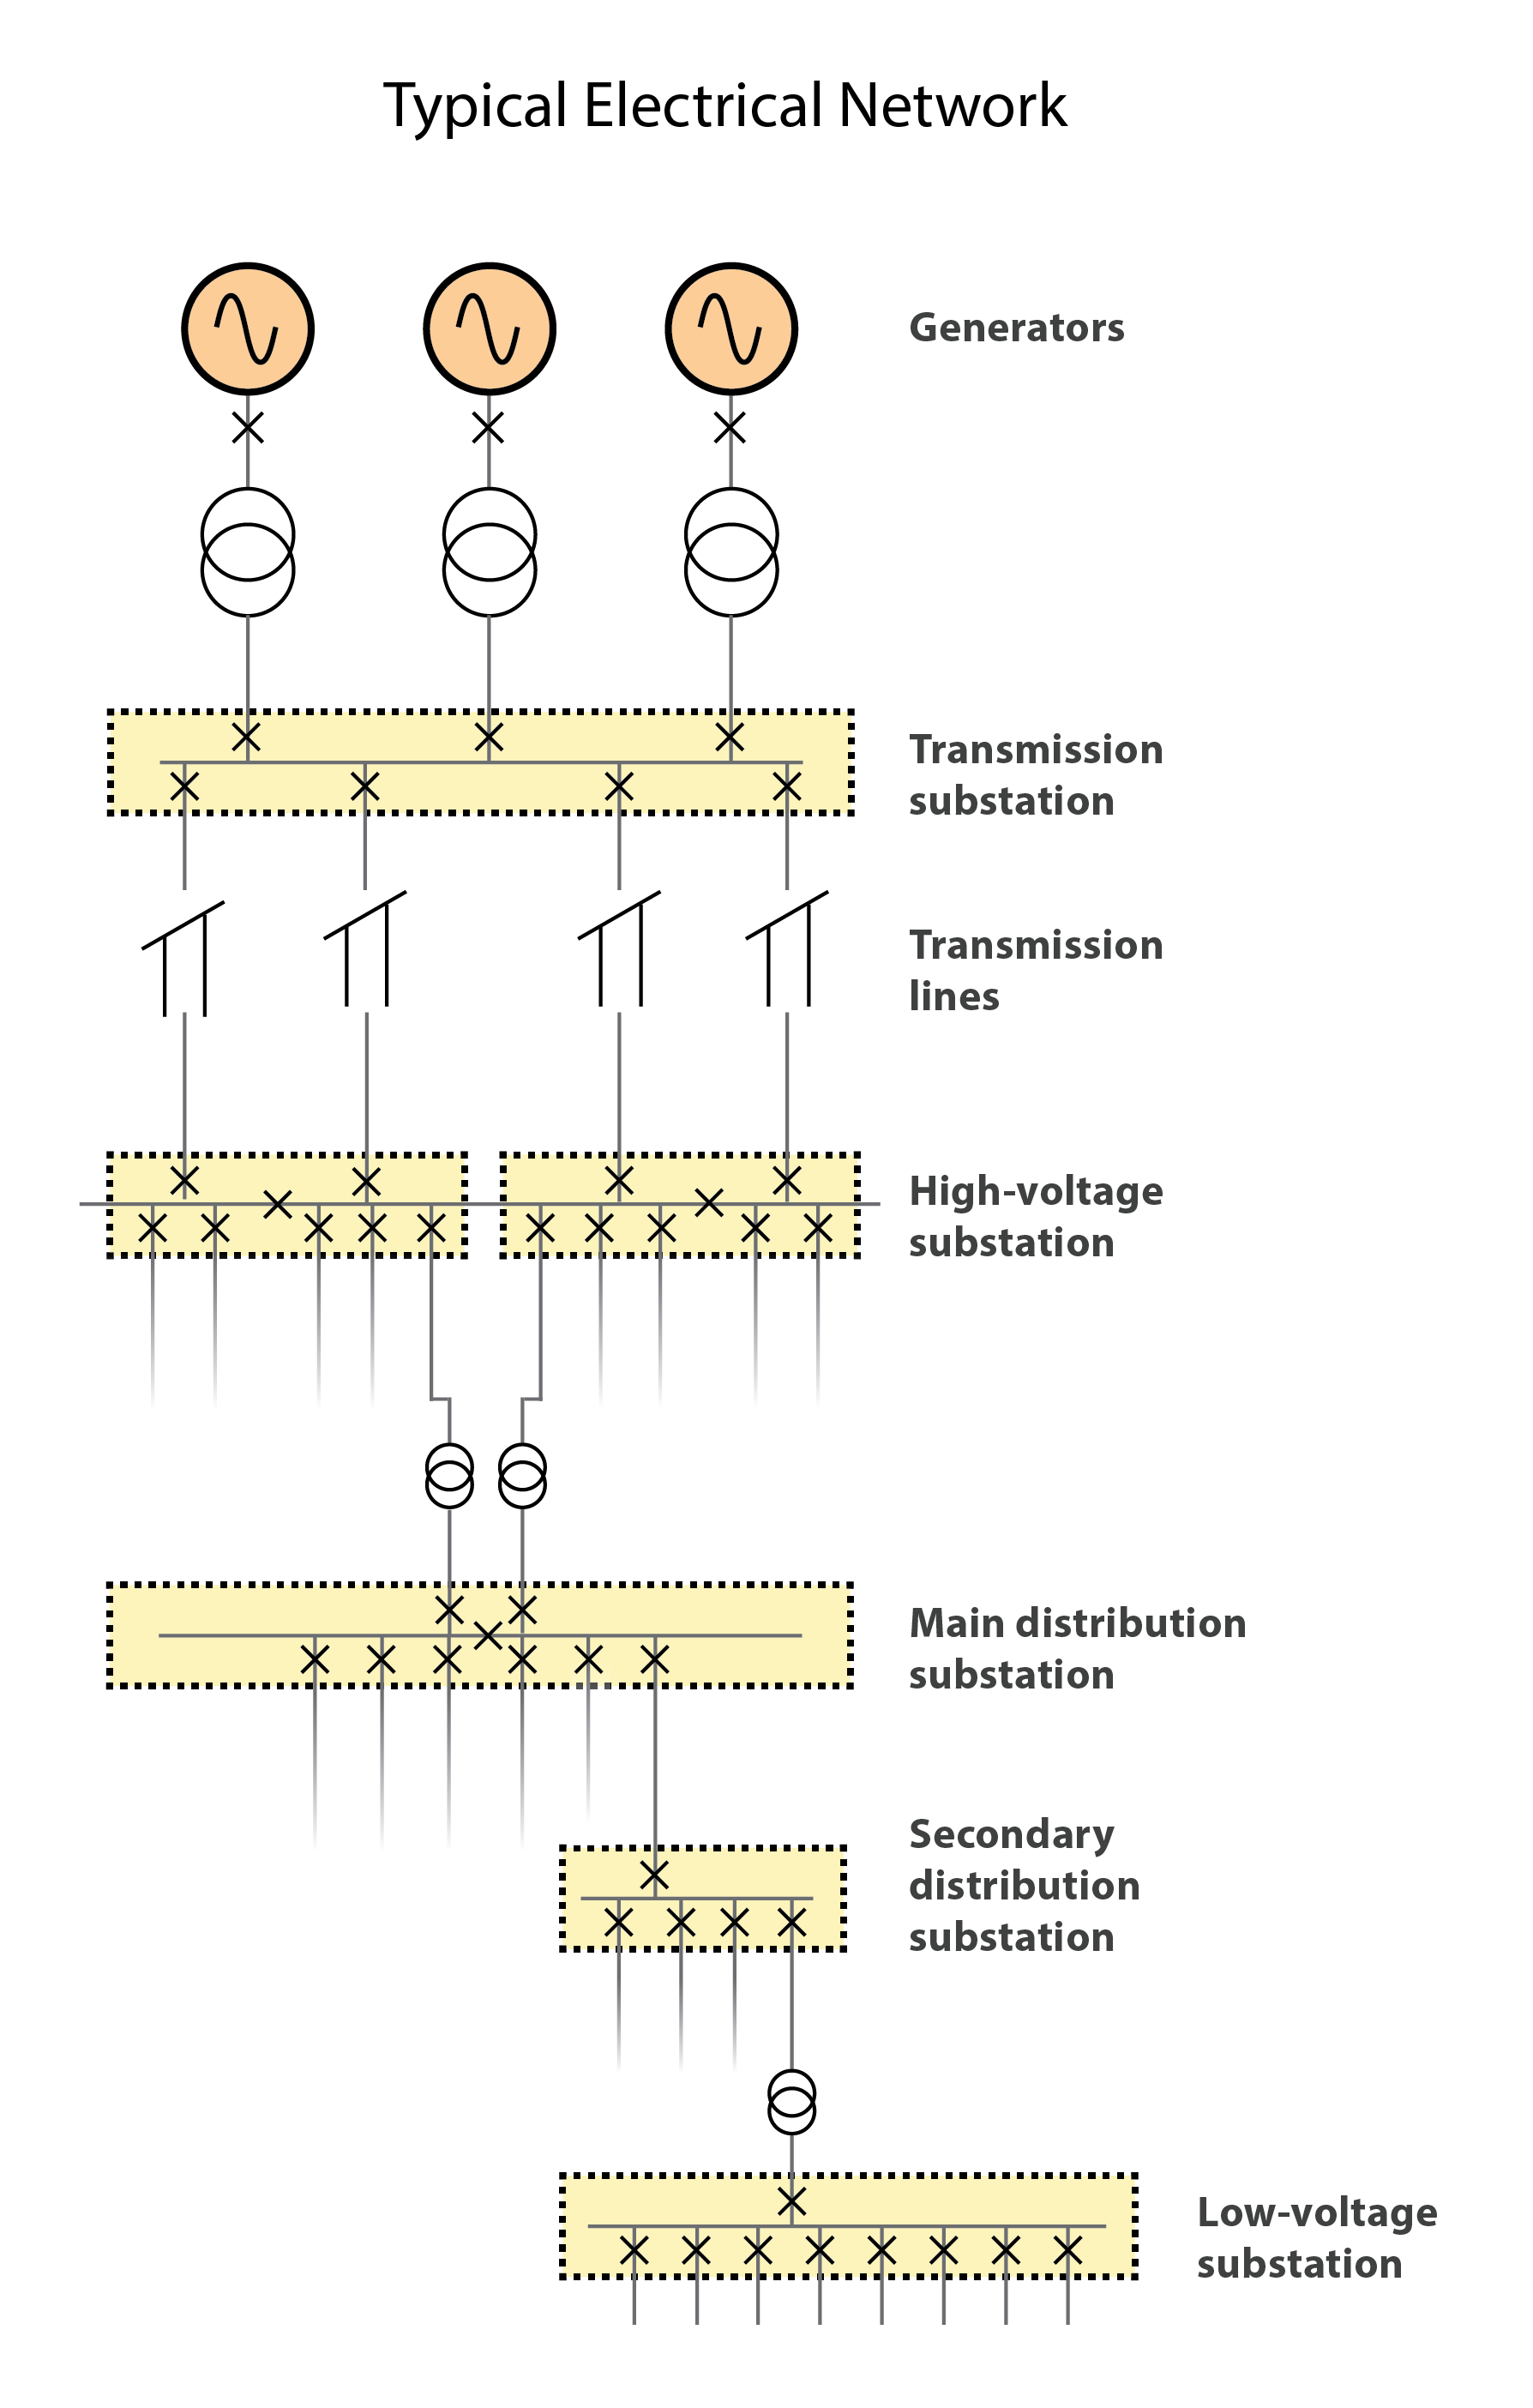
- Figure 1-1 Typical Electrical Network
Transmission and Distribution
- The electrical powers generated are either transferred onto a bus to be distributed (small scale), or into a power grid for transmission purposes (larger scale). This is done either directly or through power transformers, depending on the generated voltage and the required voltage of the bus or power grid.
- The next step is power transmission, whereby the generated electrical potential energy is transmitted via transmission lines, usually over long distances, to high-voltage (HV) substations. High-voltage substations will usually tap directly into the power grid, with two or more incoming supplies to improve reliability of supply to that substation’s distribution network.
- Electrical transmission is normally done via high to extra high voltages, in the range of 132–800 kV. Mega volt systems are now being developed and implemented in the USA. The longer the distance, the more economical higher voltages become.
- Normally, the transmission voltage will be transformed at the HV substation to a lower voltage for distribution purposes. This is due to the fact that distribution is normally done over shorter distances via underground cables. The insulation properties of three-phase cables limit the voltage that can be utilized, and lower voltages, in the medium-voltage range, are more economical for shorter distances.
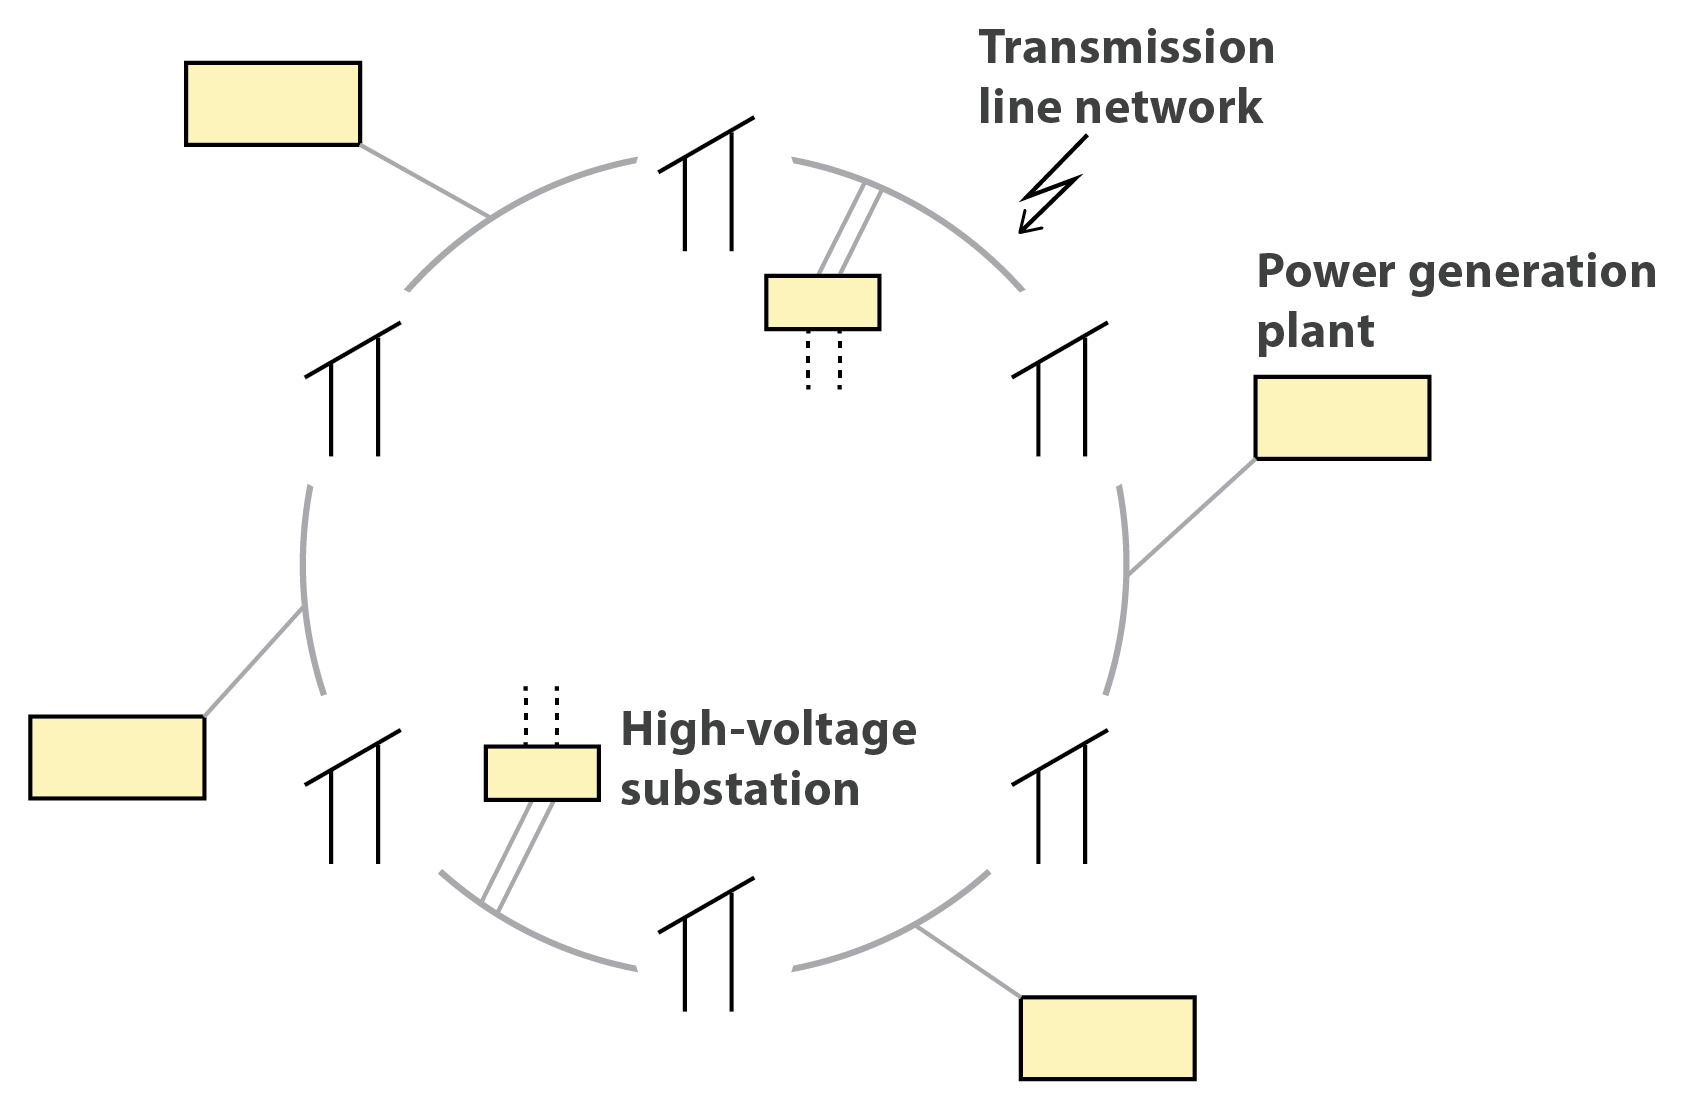
- A schematic illustration of a typical power grid.
-
Critical Medium Voltage
- Critical medium-voltage (MV) distribution substations will generally also have two or more incoming supplies from different HV substations. Main distribution substations usually supply power to a clearly defined distribution network, for example, a specific plant or factory, or for town/city reticulation purposes.
- Power distribution is normally done on the medium-voltage level, in the range of 6.6–33 kV. Three-phase power is transferred, mostly via overhead lines or 3-core MV power cables buried in trenches. Single-core-insulated cables are also used, although less often. Low-voltage distribution is also done over short distances in some localized areas.
- A power distribution network will therefore typically include the following:
- HV/MV power transformer(s) (secondary side)
- MV substation and switchgear
- MV power cables (including terminations)
- MV/LV power transformer(s) (primary side).
- The distribution voltage is then transformed to low voltage (LV), either for lighting and small power applications, or for electrical motors, which is usually fed from a dedicated motor control center (MCC). This is illustrated below.
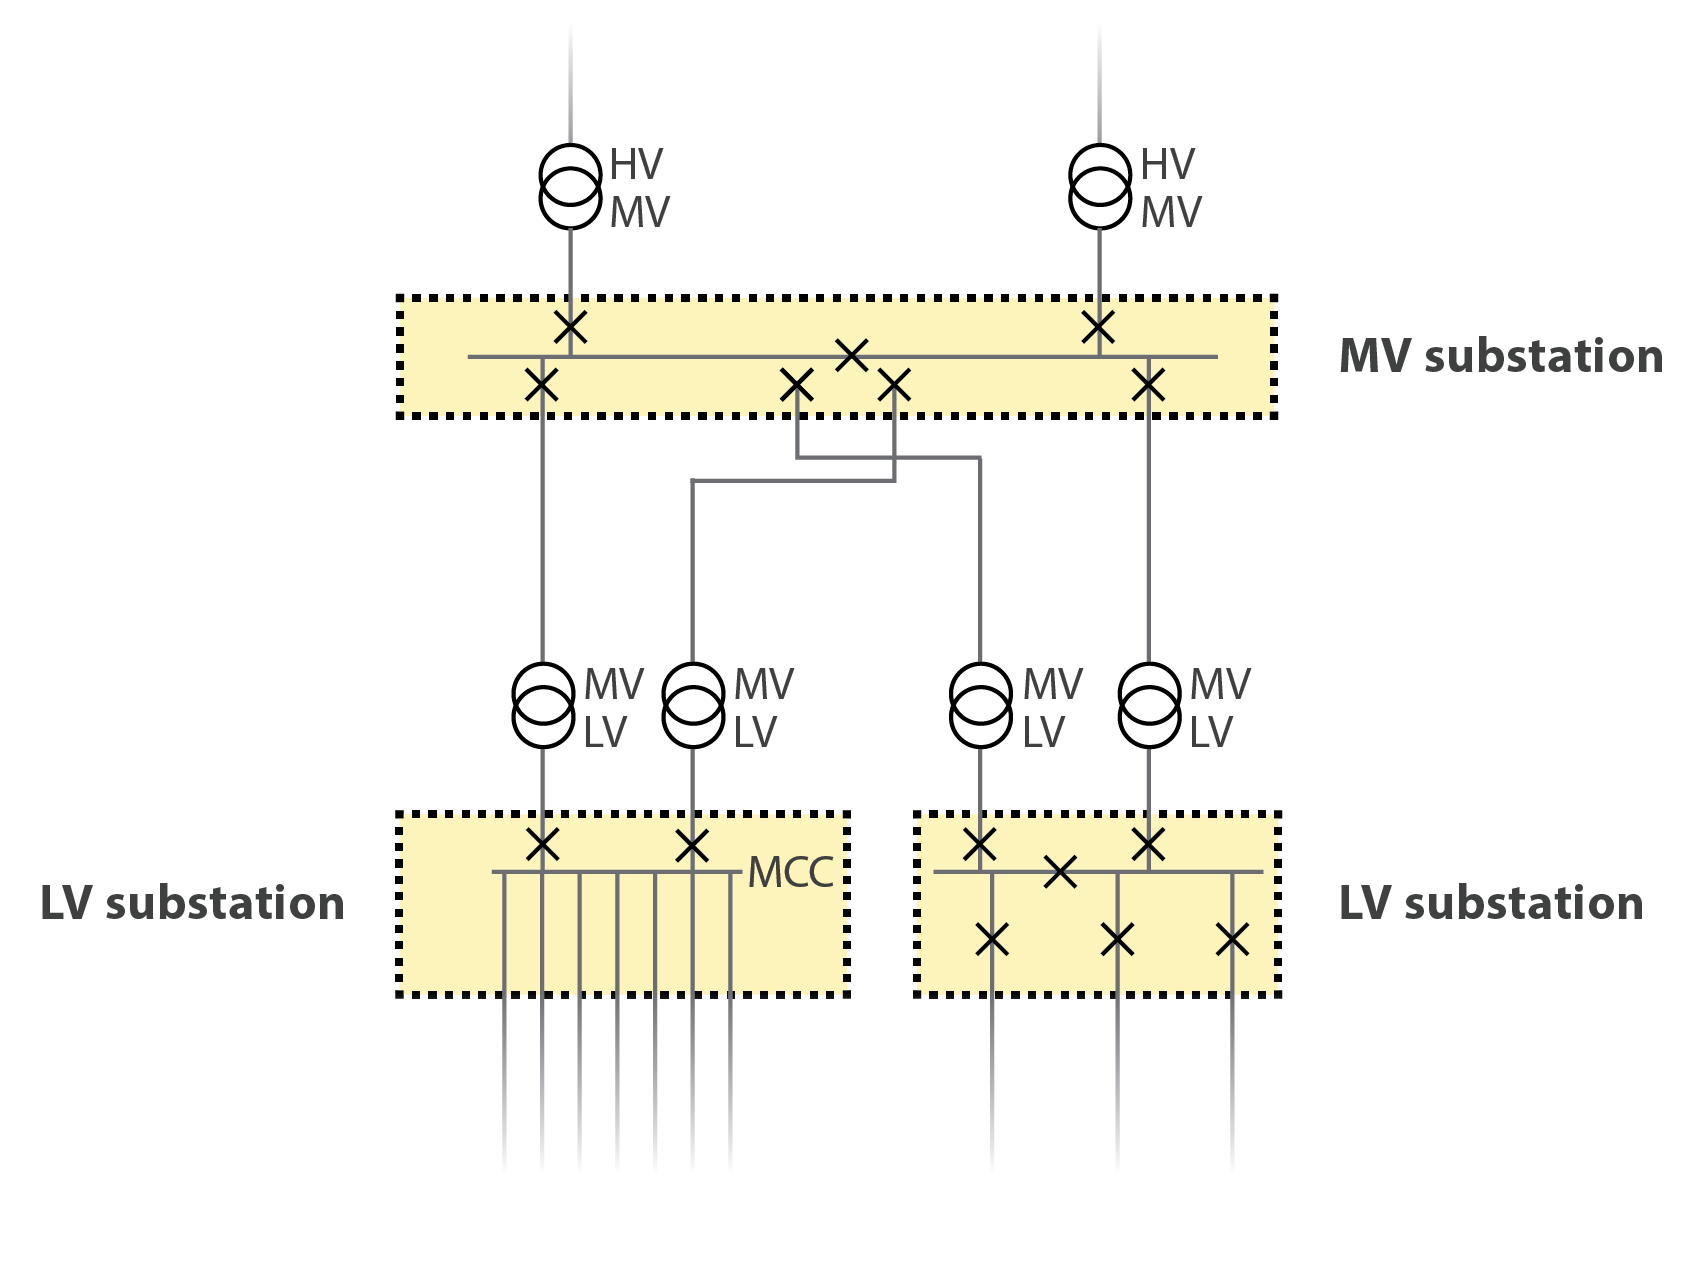
- Typical Power Distribution Network
- Note: Voltage levels are defined internationally, as follows:
- Low voltage: up to 1000 V
- Medium voltage: above 1000 V up to 36 kV
- High voltage: above 36 kV
- Supply standards variation between continents by two general standards have emerged as the dominant ones:
- In Europe
- IEC governs supply standards
- The frequency is 50 Hz and LV voltage is 230/400 V
- In North America
- IEEE/ANSI governs supply standards
- The frequency is 60 Hz and the LV voltage is 110/190 V.
- Overhead lines are far cheaper than underground cables for long distances, mainly due to the fact that air is used as the insulation medium between phase conductors, and that no excavation work is required. The support masts of overhead lines are quite a significant portion of the costs, that is the reason why aluminum lines are often used instead of copper, as aluminum lines weigh less than copper, and are less expensive.
- However, copper has a higher current conducting capacity than aluminum per square mm, so once again the most economical line design will depend on many factors.
- Overhead lines are by nature prone to lightning strikes, causing a temporary surge on the line, usually causing flashover between phases or phase to ground. The line insulators are normally designed to relay the surge to ground, causing the least disruption and/or damage. This is of short duration, and as soon as it is cleared, normal operation may be resumed. This is why sophisticated auto-reclosers are employed on an increasing number of overhead lines.
- Overhead lines have the following properties:
- Advantages
- Less expensive for longer distances
- Easy to locate fault.
- Disadvantages
- More expensive for shorter distances
- Susceptible to lightning
- Not environment-friendly
- Maintenance intensive
- High level of expertise and specialized equipment needed for installation.
- Underground (buried) cable installations are mostly used for power distribution in industrial applications. They have the following properties:
- Advantages
- Less expensive for shorter distances
- Not susceptible to lightning
- Environment-friendly
- Not maintenance intensive.
- Disadvantages
- Expensive for long distances
- Can be difficult to locate fault.
-
- Powering Africa
- The countries of sub-Saharan Africa aspire to grow their economies, and many people are frustrated by the lack of electrical power. It has 13 percent of the world’s population, but 48 percent of the share of the global population without access to electricity. There is a direct correlation between economic growth and electricity supply [1].
Follow this hyperlink and proceed to download the McKinsey report Brighter Africa - The growth potential of the sub-Saharan electricity sector.
Read the executive summary. Much of the detail presented in the main sections of the report and its appendices is of no importance at this stage but still read sufficient detail to inform and evidence your answers to the following questions.
Question 1
Why is it so crucial that government and investors develop the continent’s huge electricity capacity?
Question 2
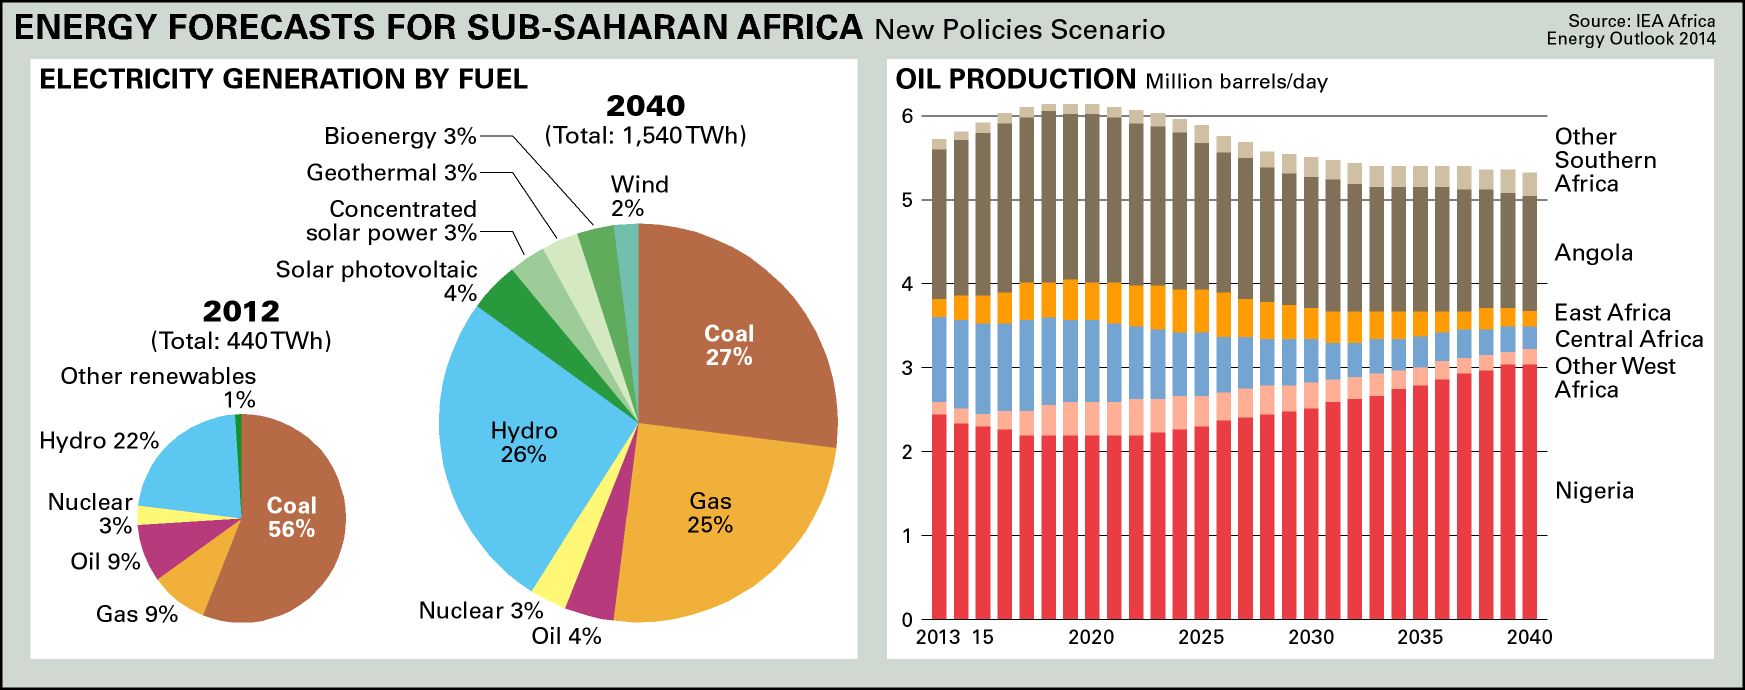
It is projected that sub-Saharan Africa will consume nearly 1,600 terawatt hours by 2040, four times what was used in 2010. What is this forecast based on?
Question 3
There is now enough support, international attention, and focus to enable this growth. Where can the potential for energy supply growth be realised?
Question 4
What is the Power Africa programme and its objectives? Is it succeeding in its well-intentioned efforts to increase the number of megawatts that are actually on the grid? What challenges is the programme facing? click here
Question 5 It is up to Africa to fulfil its potential. International players can intervene, convene, or otherwise try to lead the sector forward, but it is the responsibility of Africa’s governments to enable the development of the power industry. To move ahead on the development of the sector, national governments should take the initiative in a number of areas. Identify them.
Prepare a short word document with your answers and submit to the following link to allow the module tutor to offer you feedback on answers.
This will eventually link to a Blackboard Assignment
Helpful Reading Links
[1]. http://www.mckinsey.com/industries/electric-power-and-natural-gas/our-insights/powering-africa
[2]. https://www.bloomberg.com/news/articles/2016-09-21/africa-left-in-dark-as-9-7-billion-obama-power-plan-falls-short -
-
-