-
7.0 Sequence & Communication Diagrams
- Sequence diagrams show how objects interact with each other, emphasising the order of the interactions and the messages between objects over time.
- Communication (collaboration) diagrams show interactions in the context of the classes that participate in the interaction, showing the structural relationships of the classes to one another.
- Communication Diagrams
- In object orientated terms the functionality that users require of the system is produced by objects working together. Each individual object provides only a small element of the functionality but when objects work together systems are able to produce high level functionality. In order to work together in this way objects need to communicate with one another and they do this by passing messages. This working together to produce some useful result is modelled in the interaction diagrams
- Communication Diagrams are a kind of Interaction diagram, which were previously (before UML 2) called collaboration diagrams. Like sequence diagrams, they are used to model interactions between objects that deliver the functionality of a use case by showing the messages that are passed between participants (usually objects). A communication diagram looks like a class/object diagram, but it has messages added to the links between classes and a numbering system before each message to give the order in which they are sent.
-
7.1 Uses of a Communication Diagram
- Communication Diagrams can be used while the class diagrams are being elaborated to help the analyst understand the groupings of objects that participate in the realisation of the use case. They can also be used to specify the objects that take part in operations. We need to remember that the process of developing an Object-Oriented System is iterative – these interaction diagrams might identify new classes/attributes/operations that need to be added to the class diagram.
- If they’re similar to sequence diagrams, why do we need them and when do we use them?
- In general sequence diagrams are better at showing the sequence of calls (messages) whereas communication diagrams are better at showing links between objects/participants. Sequence diagrams are better for showing control logic, like loops and selection (if .. else). However, Communication diagrams are easier to draw and to change quickly. Easier in brainstorming sessions (e.g. scribbling on a whiteboard). If used like this, it’s a similar technique to CRC cards.
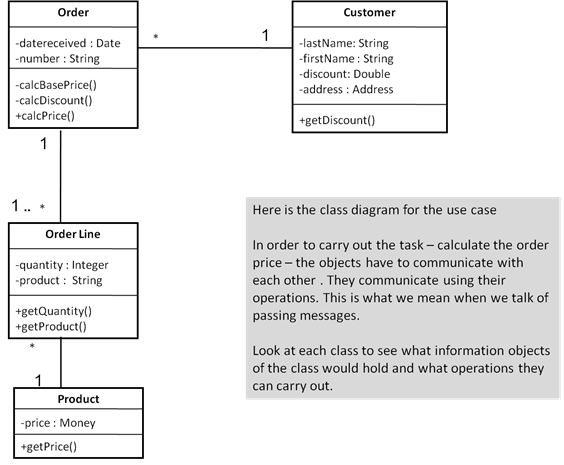
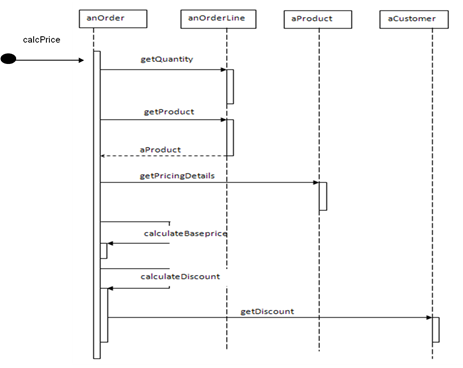
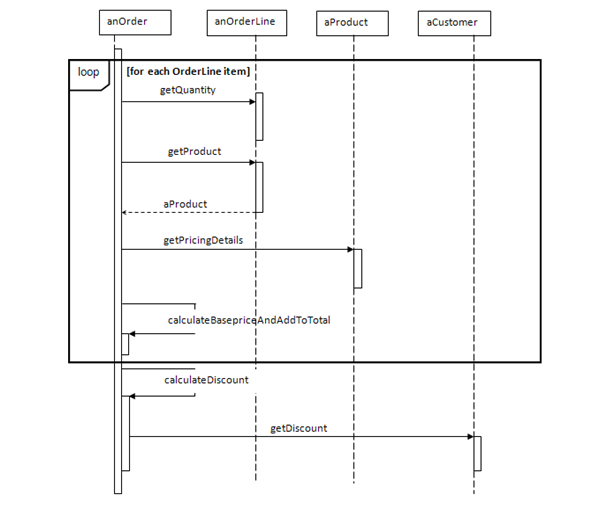
- Here is the Sequence diagram for the price calculating use case. On the next slide it is shown as a Communication diagram...
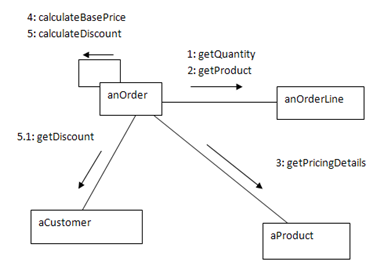
- Communication Diagram of the Calculate Order Price use case
-
7.2 Notation of Communication Diagrams
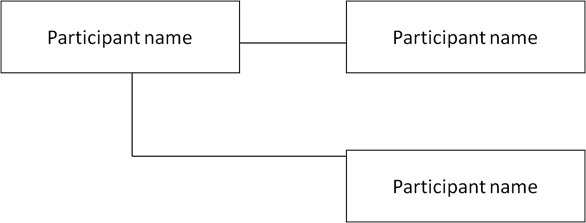
- Communication diagrams show how instances of classifiers collaborate to achieve some objective; either an operation or a use case. The classifier instances that are most common are objects. these are shown as lifelines (same as in sequence diagrams) but without dashed line. Lifeline names are simpler than in UML 1.X and are no longer underlined.
- Example:
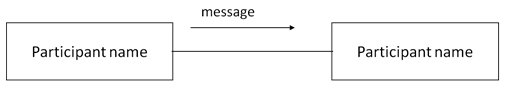
- Participants

Links are ONLY drawn on communication diagrams to support the passing of messages between the participants in the interaction
- Links
- Links how the paths along which messages can be sent. Links may be instances of associations that are shown on the class diagram or may be temporary links between lifelines that enable them to send messages to each other, e.g. a control object may need to create an instance of a particular class as part of a collaboration, but the link is temporary so it will not be shown in the class diagram.
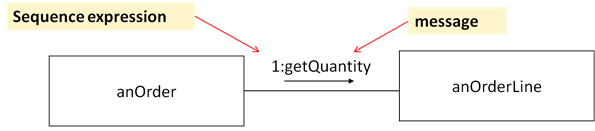
- Messages
Messages are shown by an arrow pointing in the direction that the message is sent and a lable that specifies the message
A message is the same as a message in Sequence diagram, and is defined as a specification of the conveyance of information from one instance to another with the expectation that activity will ensue.
A message may specify the raising of a signal or the call of an operation
Message may be one of the following
a signal sent from one object to another
an operation being invoked on another object
creation/destruction of an object instance
- The arrow in the above diagram represents the flow of control. The message arrows are the same as those for sequence diagrams. Where the flow of control is synchronous there is only one thread of execution, therefore, the activity passes from one lifeline to another. Where the flow of control is asynchronous more than one lifeline can be active at any one time. The amount of detail about the message that is shown alongside the arrow can vary considerably. At its simplest, its just the name of the message and a sequence number...
The syntax for messages is the same as that for sequence diagrams
Sequence-expression [attribute=] signal-or-operation-name [(arguments)] [:return-value]
However, the notation for communication diagram includes the sequence-expression
(a number) at the start -
7.3 Sequence expressions & Recurrence (loops)
- A Sequence expression defines the order in which the interactions take place. It is a dot separated list of sequence-terms followed by a colon. Each term represents a level of nesting within an interaction. If an object receives an operation call numbered 1: and as a result sends an operation call to another two objects the operation calls will have sequence expressions 1.1: and 1.2:
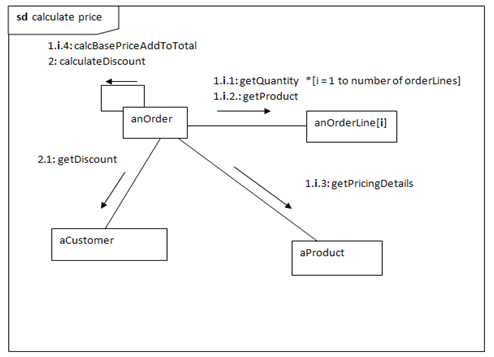
- Recurrence (loops) are used for messages that are sent iteratively or are sent depending on a guard condition. They are shown using an *, e.g. *[while not end-of-file]. It is equivalent to a loop combined fragment in a sequence diagram.
- Communication Diagram of the Calculate Order Price use case With recurrence
-
7.4 Producing Communication Diagrams
- Steps of producing a communication diagram:
- Decide on the context of the interaction: system, subsystem, use cases or operation
- Identify the structural elements (objects, subsystems) necessary to carry out the functionality of the interaction
- Model the structural relationships between those elements to produce a diagram showing the context of the interaction
- Consider the alternative scenarios that may be required
- Draw communication diagram
- Star UML:
- A Communication (Collaboration) Diagram can be easily created from an existing Sequence Diagram
- Select Sequence Diagram in Model Explorer
- From Main Menu :
- Model -> Convert Diagram -> Sequence to Collaboration
- Tidy up Diagram – using drag-and drop
-
7.5 Interaction Diagrams
- In UML – there a FOUR types of Interaction Diagrams :
- Sequence Diagrams
- Communication Diagrams
- Timing Diagrams
- Interaction Overview Diagrams
- Timing Diagram
- A Timing Diagram is a specific type of interaction diagram, where the focus is on timing constraints. Timing diagrams are used to explore the behaviours of a single object or a collection of objects throughout a given period of time. A timing diagram is a special form of a sequence diagram. The differences between timing diagram and sequence diagram are the axes are reversed so that:
- time is increased from left to right
- lifelines are shown in separate compartments arranged vertically.
- Timing Diagrams are not frequently used.
- Example
- Let's take a simple scenario based on the pump and hotplate for a coffee pot. Let's imagine a rule that says that at least 10 seconds must pass between the pump coming on and the hotplate coming on. When the water reservoir becomes empty, the pump switches off and the hotplate cannot stay on for more than 15 minutes more.
- Ex 1 - showing states as lines

- Ex 2 - showing states as areas
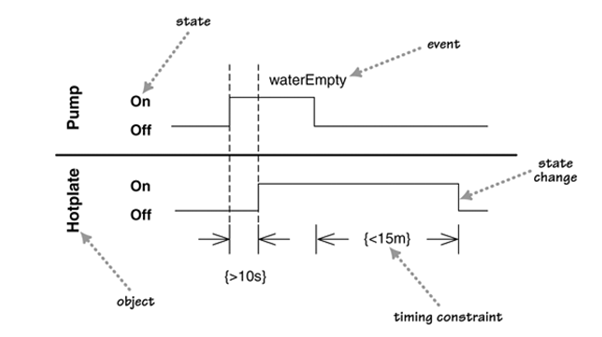
- Both of these examples illustrate alternative ways of showing the timing constraints and both diagrams show the same basic information. The main difference is:
- Ex. 1 shows the state changes by moving from one horizontal line to another
- Ex. 2 retains the same horizontal position but shows state changes with a cross.
- The style of Ex. 1 works better when there are just a few states, as in this case, and Ex. 2 is better when there are many states to deal with.
-
7.6 Interaction Overview Diagrams
- Interaction overview diagrams are a grafting together of activity diagrams and sequence diagrams. They are used to model the high level flow of control between interactions. You can think of interaction overview diagrams either as either activity diagrams in which the activities are replaced by small sequence diagrams or as a sequence diagram broken up with activity diagram notation used to show control flow.
- Example:
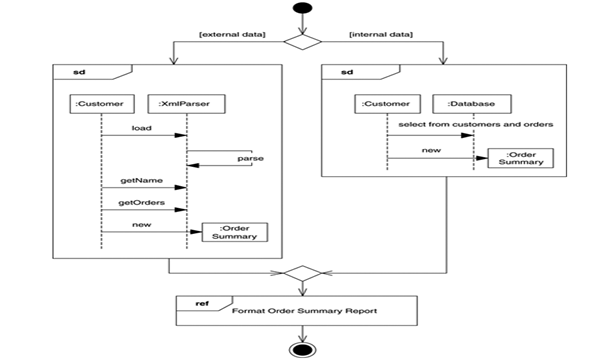
- The notation is familiar, it uses activity diagrams and sequence diagrams In this Example , we want to produce and format an Order Summary Report:
- If external customer - we get the information from XML
- if internal customer - we get it from a database.
- Small sequence diagrams show the two alternatives. Once we get the data, we format the report; in this case, we don't show the sequence diagram but simply reference it with a reference interaction frame.