-
3.0 Activity Diagram
Contents
- Activity Diagrams
- Use of Activity Diagrams to validate use cases
- (Activity Diagrams are also discussed in Schaum chapter 11)
Activity Diagrams
- Are used to describe :
- Procedural logic
- Business process
- Work flow
- Can be used to describe in a variety of ways :
- business process models – i.e. activities and flows which support a (business) process
- complex flows within or between use cases
- the flow within an operation in detail (at the Design stage)
- They are basically sophisticated versions of flowcharts
- Here we are interested in them as ways of describing the flow of actions in a use case – but we will also look at some process examples
Context for Activity Diagrams
- 📷 Activity Diagram
- Not all use cases need to be described using an activity diagram.
- Only the more complicated ones.
- The use case form’s “main flow of events” & “alternative flow of events” sections are the basis for these diagrams
- 📷 Activity Diagram
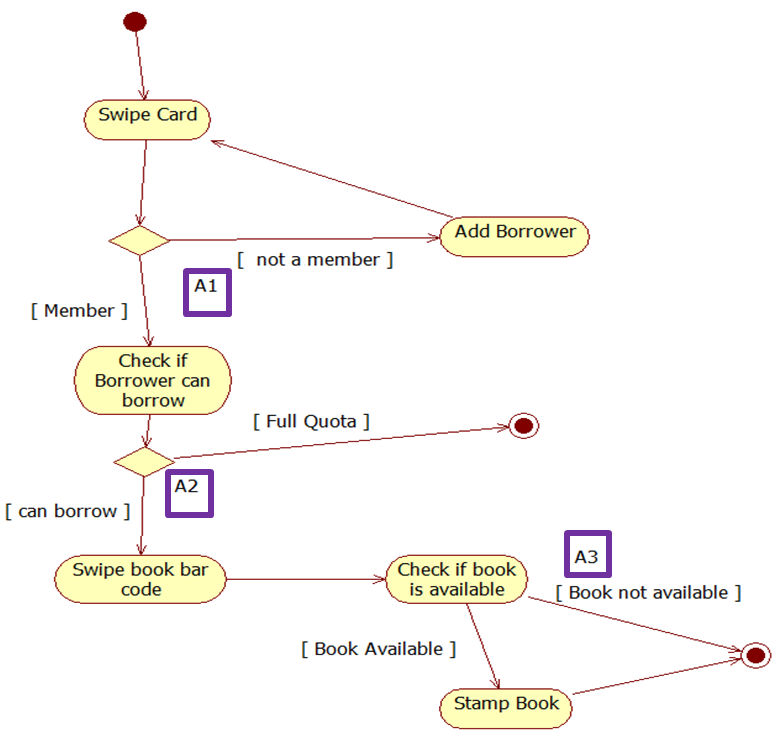
‘Borrow Book’ Use Case (Activity)- Example
Main Flow of Events
- 1. Librarian swipes the borrower’s library card. [A1]
- 2. Librarian checks that the borrower does not already have his full quota of books on loan. [A2]
- 3. Librarian swipes the books bar code.
- 4. Librarian checks that the book is available for loan. [A3]
- 5. Librarian stamps the book with the return date and hands the book to the borrower
Alternative flow Of Events
- A1. Borrower is not a library member.
Librarian adds Borrower as new member (“Add new Library Member”).
Return to step 1.- A2. Borrower has full quota of books out already.
End of use case.- A3. Book is not available for loan. (i.e. Reference Book)
End of use case.- SEE LATER FOR SOLUTION
X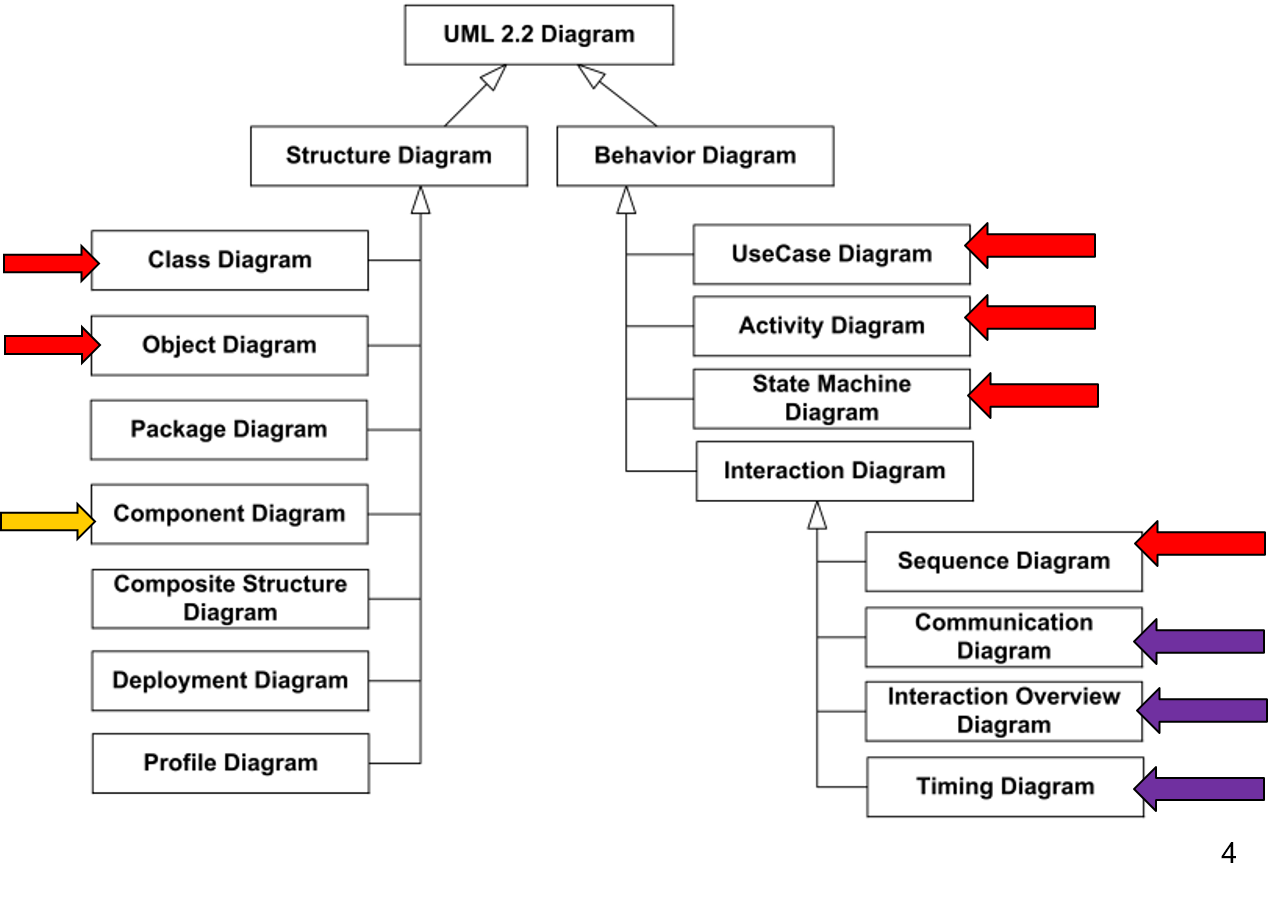 X
X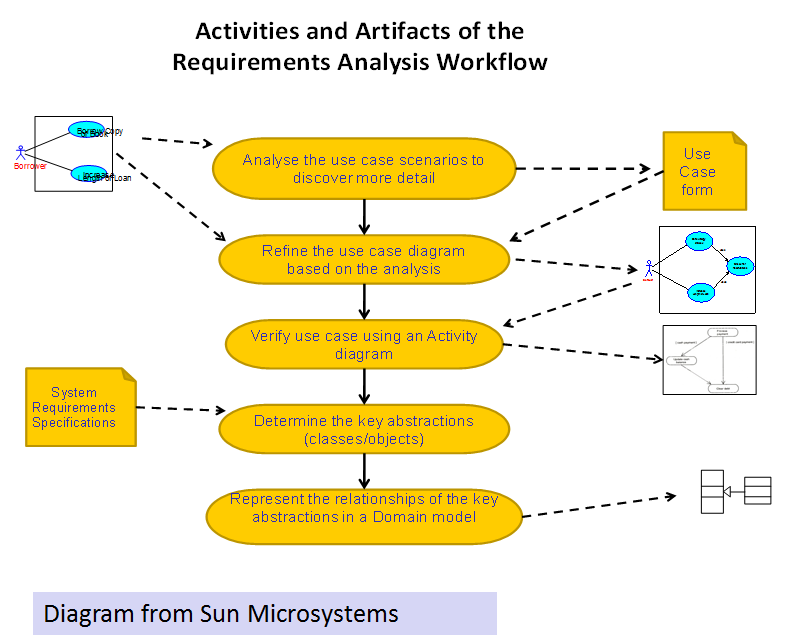
-
Notation
Activity
- An Activity is the process being modelled
- An Activity is a unit of work that needs to be carried out
- An activity is a workflow that can be drawn with a diagram
- Activity name is written in the top left hand corner
- Inside the activity a number of actions are linked to describe the workflow
- Activities should only have one start point, but can have a number of end-points
- An Activity itself can describe the implementation of a use case.
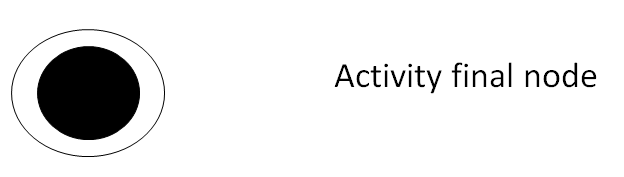
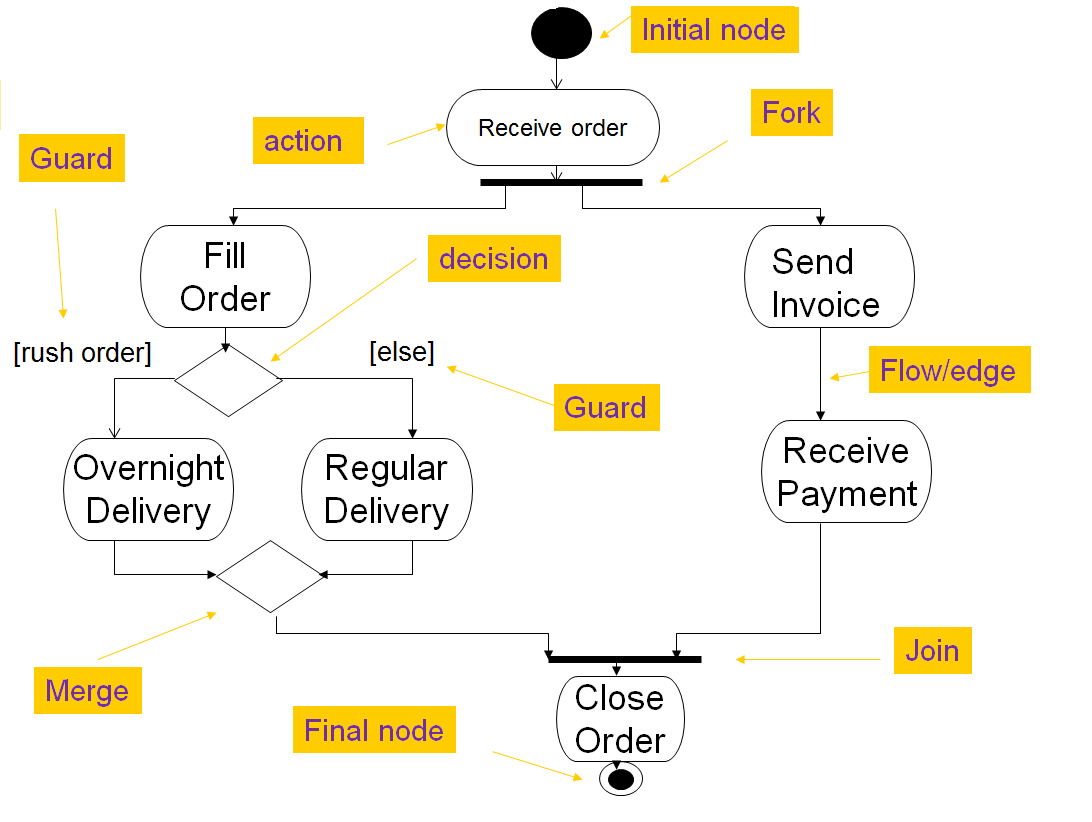
Activity Initial and Final Nodes
- Initial node. The filled in circle is the starting point of the diagram. An initial node isn’t required although it does make it significantly easier to read the diagram.

- Activity final node. The filled circle with a border is the ending point. An activity diagram can have more than 1 activity final nodes.
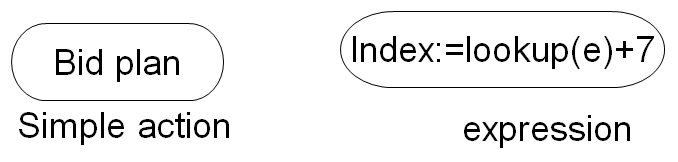
Action
- Basic element of an Activity
- Is a unit of work that needs to be carried out
- The rounded rectangles represent actions (not activities) that occur
- It may take a long time or a short time.
- Actions can be decomposed into subactivites – nesting an activity in an action (actions can have multiple flows in and multiple flows out)
Activity Edge (or Flow)
- Is shown as an arrow
- When an action completes execution, flow of control passes immediately to the next action
- So no need for a label for actions or events
- The only label that may be used is a Guard Condition
Decision Nodes
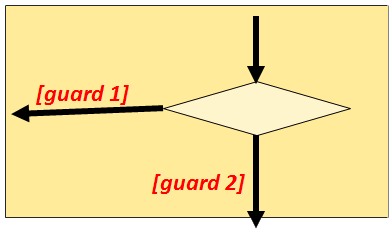
- Has a single (usually) incoming flow
- Has several guarded (conditional) out bound flows
- Each outbound flow has a guard
- A guard is a boolean condition placed inside square brackets e.g. [priority order]
- Each time you reach a decision you take only one of the outbound flows
- The guards are mutually exclusive
- [else] flow indicates all other guards on the decision are false
Merges
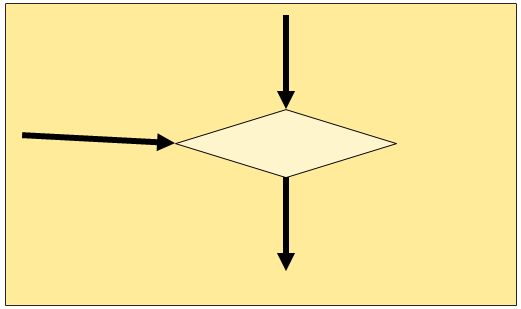
- A merge has multiple input flows and a single output
- A merge marks the end of conditional behaviour started by a decision
-
Guards (Conditions) & Decisions
- If there are two or more possible flows of control from an action (two or more alternative actions that control may go to next), this can be drawn in two different ways.
- Either :
- a single edge leaves the first action and goes to a Decision Node. The alternative edges then leave the decision node labeled with guards. (ex 1a)
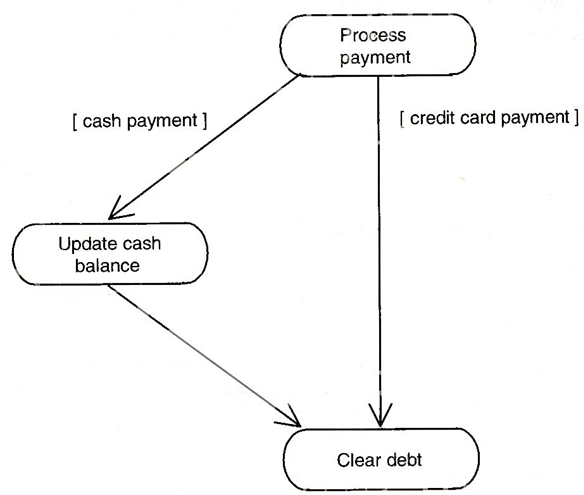
- or
- the alternative edges are drawn, with guards, leaving the first action (ex 1b)
- 📷 Ex 1a - Multiple exits from an action - With decision Node
- 📷 Ex 1b : Multiple exits from an action using guards
[ Guards ]
- Multiple exits from an action
- ( see previous two examples )
- Guards MUST ALWAYS be used
- Guards MUST ALWAYS have Square Brackets
- …. [ guard ]
- ALL Alternative Flows MUST have a Guard
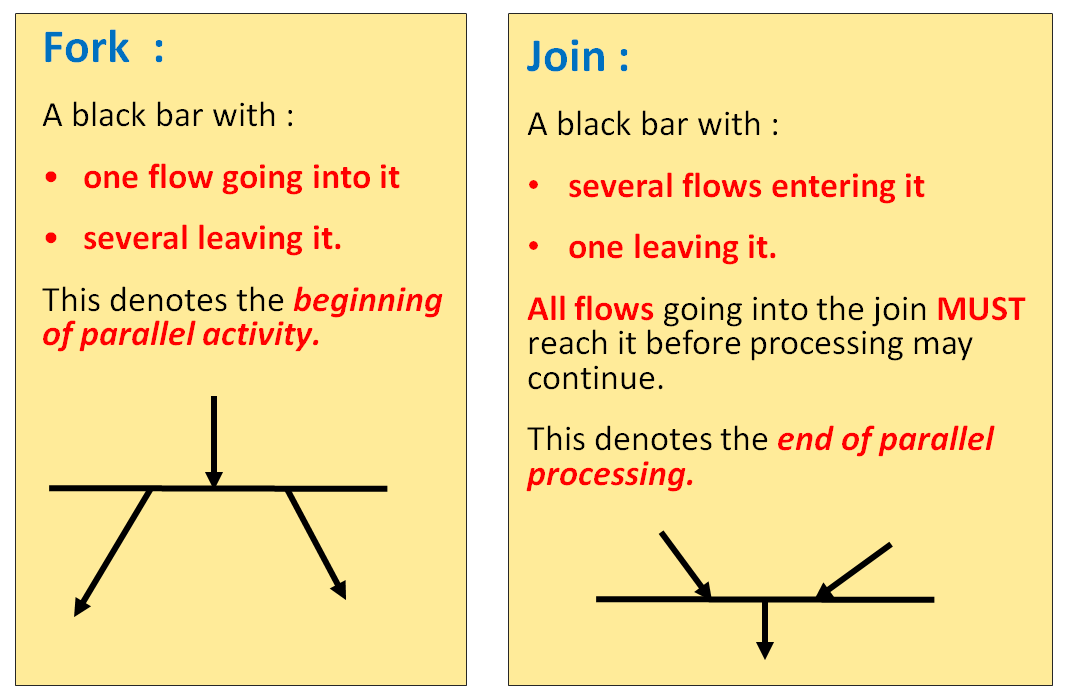
Concurrency - Using Forks & Joins
- Concurrency occurs when a number of Actions run in parallel
- The multiple paths are shown using a Fork node
- Once ALL the actions are completed can then continue - (using a Join Node)
Forks & Joins
Forks & Joins - Example
- Product is designed first
- The product is marketed and manufactured concurrently
- The product is sold ONLY after :
- BOTH the Marketing AND the Manufacturing are complete
- 📷 Example Diagram
Activity Partitions
- are used to show who (or what) is doing specific activities in the activity model.
- Partitions are denoted using columns and the specific activities are grouped into these columns
- Activity diagrams tell you what happens, but they do not tell you who does what
- If you want to show who does what – you can divide an activity diagram into partitions – which show which action one class or organisation unit carries out.
- “Activity Partitions” can be used to show who or what is carrying out the actions in the diagram.
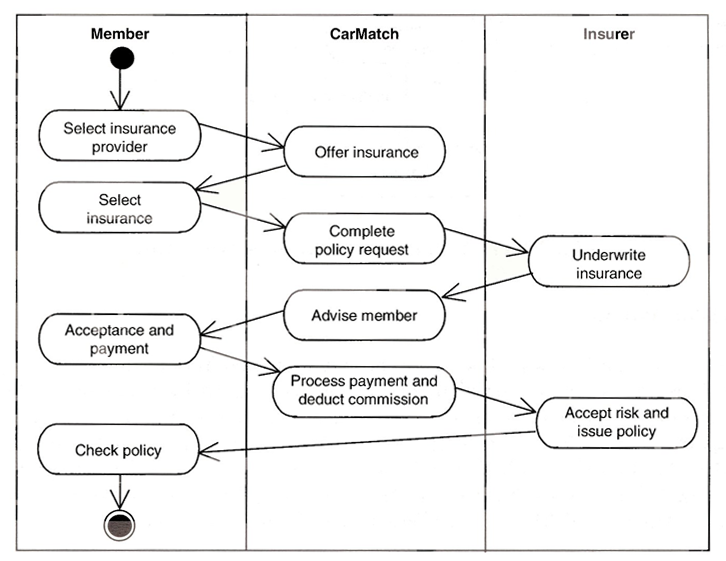
- The following Activity Diagram is for an activity : “Process Order”
- It includes most of the notation required in Activity Diagrams
 X
X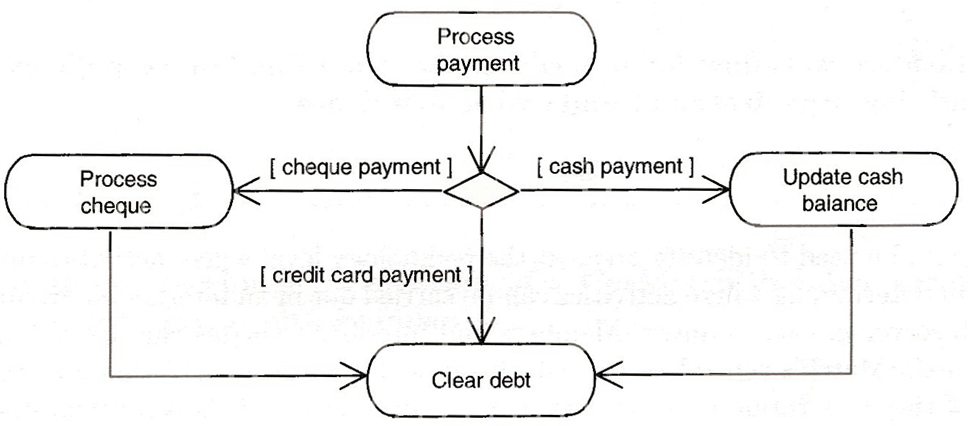 X
X- Decision Nodes should be used – see previous diagram
- But this technique may also be used
 X
X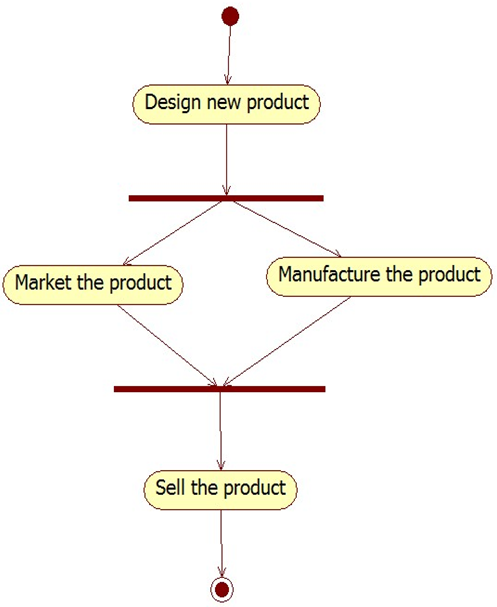
-
Activity Diagrams are useful in the following situations
- Analysing a use case
- Verifying a use case with stakeholders
- Understanding workflow
- Describing a complicated sequential algorithm
- Dealing with multithreaded applications
- Each of these can be described as a Activity
Example
- Draw an Activity Diagram to model the workflow in the process (activity) of making a cup of tea
- We’re using a tea bag in a cup – main flow
- Option to have milk – alternative flow(s)
- can be added before or after the water
- (will ignore sugar/sweeteners in this example)
Main Flow Of Events
- Main Flow Of Events: ( without milk)
- 1. Fill kettle
- Boil kettle
- 2. Get Tea bag
- 3. Get Cup
- Place Teabag in Cup
- ( Note : No particular order for steps 1 -> 3 )
- 4. Add Boiled Water to Cup [A1]
- End of use Case
All Event
Main Flow Of Events
- 1. Fill kettle
- Boil kettle
- 2. Get Tea bag
- 3. Get Cup
- Place Teabag in Cup
- ( Note : No particular order for steps 1 -> 3 )
- 4. Add Boiled Water to Cup [A1]
- End of use Case
Alternative Flow Of Events
- A1 Add Milk [A2]
- A2 Add Milk before Water (Add Milk To cup and then Add Water to cup)
OR
Add Milk after water (Add Water to cup and then Add Milk To cup)
End of use case.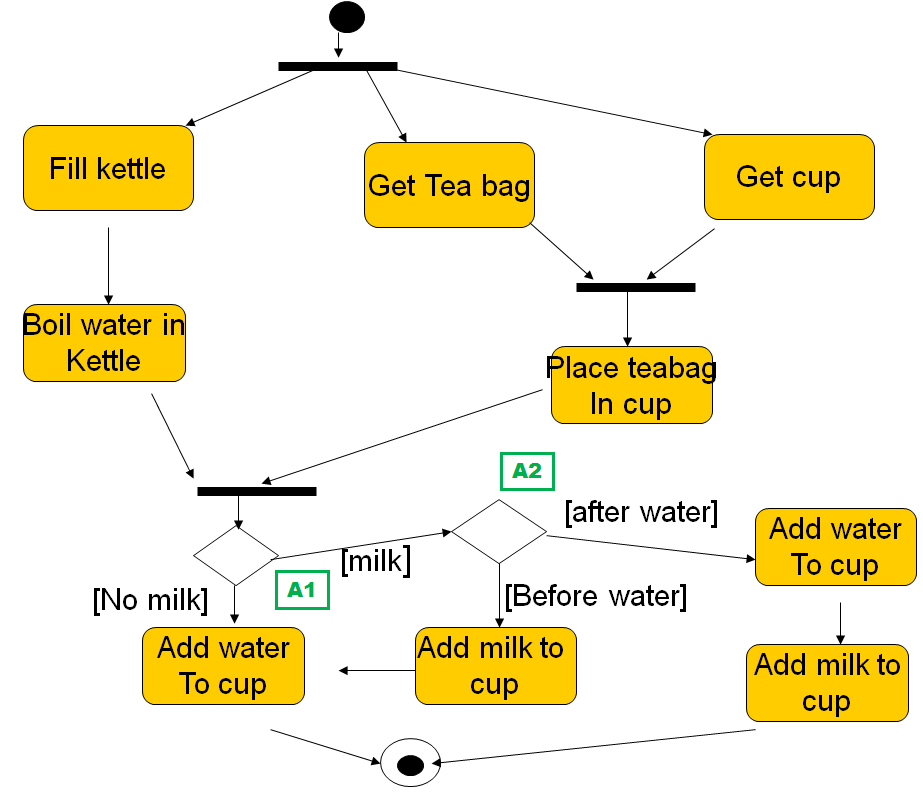
- Note the use of A1, A2 etc in the Activity Diagram
- These are the Alternative Flows of Events from the Use Case Description
- The use of A1/A2 etc do not need to be shown on the Activity Diagram – BUT they do help the checking to ensure that all flows appear on the Activity Diagram
-
‘Borrow Book’ Use Case (Activity)- Example
Main Flow of Events
- 1. Librarian swipes the borrower’s library card. [A1]
- 2. Librarian checks that the borrower does not already have his full quota of books on loan. [A2]
- 3. Librarian swipes the books bar code.
- 4. Librarian checks that the book is available for loan. [A3]
- 5. Librarian stamps the book with the return date and hands the book to the borrower
Alternative flow Of Events,
- A1. Borrower is not a library member.
- Librarian adds Borrower as new member ( “Add new Library Member”).
- Return to step 1.
- A2. Borrower has full quota of books out already.
- End of use case.
- A3. Book is not available for loan (i.e. Reference Book)
- End of use case.
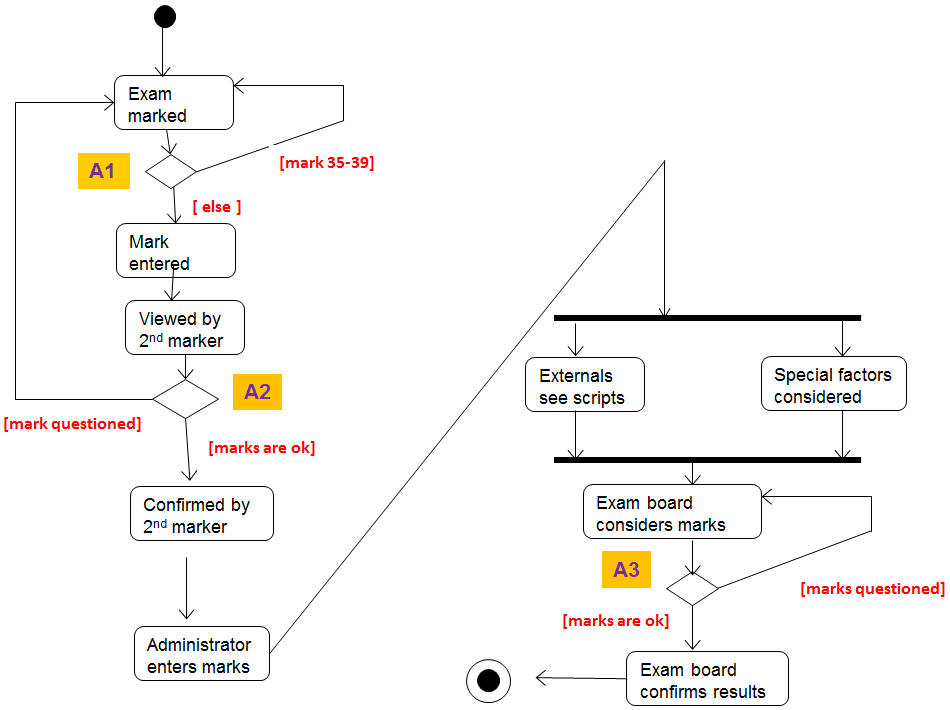
Exam Marking Process (activity) - Example
Main Flow of Events
- 1. Exam is marked. [A1]
- 2. Mark entered in mark sheet.
- 3. Exam paper given to 2nd marker. [A2]
- 4. Mark confirmed by 2nd marker.
- 5. Mark passed to administrator to be entered in system.
- 6. External examiner looks at exam paper while special factors committee considers any special factors.
- 7. Exam Board considers result. [A3]
- 8. Exam Board confirms result.
- 9. Administrator updates system.
Alternative flow Of Events
- A1. Mark between 35 & 39 return to step1 (remark paper)
- A2. 2nd marker thinks paper is incorrectly marked return to step1 (remark paper)
- A3. It is suggested that mark be changed return to step 7 (reconsider)
-
Additional Notation
- Sub-Activities (Call Behaviour Actions)
- Event-Based Actions
- Accept Signal
- Time Signal
- Send Signal
Sub-Activities
(Call Behaviour Actions)
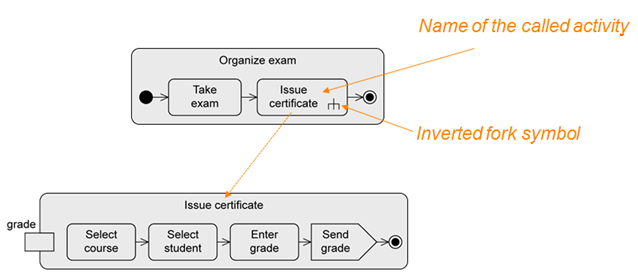
- Actions can call activities themselves.
- These actions are referred to as sub-activities – or call behaviour actions
- They can be used to split a system into smaller parts
- Notation :
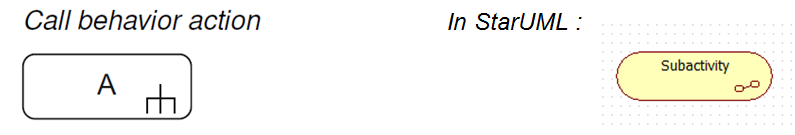
Example is from UML@Classroom :
- The execution of an action can call an activity
- Content of the called activity can be modeled elsewhere
- Advantages:
- Model becomes clearer
- Reusability
Event-Based Actions
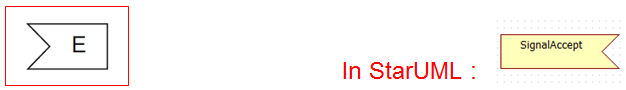
- Event-based actions enable objects and signals to be transmitted to receiver objects.
Accept Signal :
- The signal indicates that the activity receives an event from an outside process. The activity constantly listens for these signals
- The notation element for an accept event action is a “concave pentagon”—a rectangle with a tip that points inwards from the left.
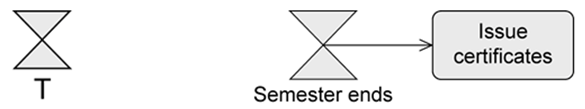
Time Signal :
- If the event is a time-based event, (e.g end of the month, Semester starts, etc) - the notation is an hourglass.
- (Note : Time signal is NOT available in StarUML)

- To accepts events
- Accept event action
- Accept time event action
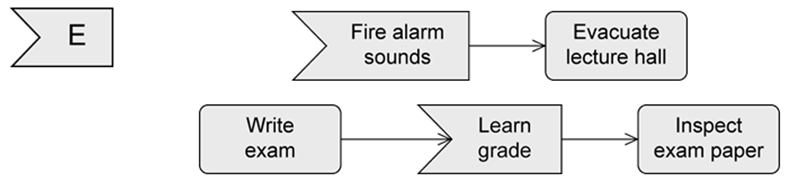
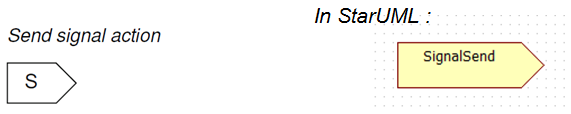
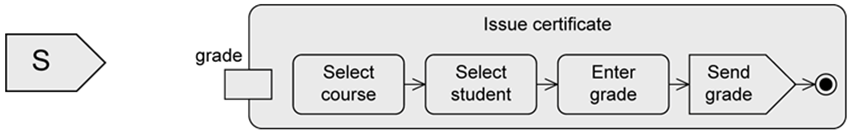
Send Signal:
- Although, the Accept and Time Signals are just waiting for an external event – we can also use a Send signal
- To send signals, you can use send signal actions.
- Send signal actions are denoted with a “convex pentagon”—a rectangle with a tip that protrudes to the right.
Event-Based Actions
- To send signals
- Send signal action
-
UML@Classroom
- Activity Diagram Slides from UML@Classroom can be downloaded here
For info :
- Some of the examples used by UML@Classroom for Activity Diagrams do not model complete processes—some of the models are restricted to extracts of processes.
- Thus, for example, some of the diagrams do not contain initial and final nodes. In practice, however, a complete activity diagram MUST have clearly defined start and end points.
And finally …..
- Activity Diagrams Tutorial
- Must be done for next week
- StarUML Videos :
- Activity Diagrams
- Printing Diagrams