-
9.0 Communication (Collaboration) Diagrams, Timing Diagrams, Interaction Overview Diagrams
Sequence & Communication Diagrams
- Sequence diagrams :
- show interactions and emphasise the order of the messages over time
- Communication (collaboration) diagrams :
- Show same interaction in the context of the classes that participate in the interaction
- Show the structural relationships of the classes to one another
Communication Diagrams
- These are a kind of Interaction diagram
- Previously (before UML 2) called collaboration diagrams
- Like sequence diagrams, they are used to model interactions between objects that deliver the functionality of a use case by showing the messages that are passed between participants (usually objects)
- A communication diagram looks like a class/object diagram, but it has :
- messages added to the links between classes
- a numbering system before each message to give the order in which they are sent.
- Refer to Module Handout B for a detailed description
- (Reading Schaum chapter 10)
-
Uses of a Communication Diagram
- Can be used while the class diagrams are being elaborated to help the analyst understand the groupings of objects that participate in the realisation of the use case
- They can also be used to specify the objects that take part in operations
- We need to remember that the process of developing an Object-Oriented System is iterative – these interaction diagrams might identify new classes/attributes/operations that need to be added to the class diagram
- If they’re similar to sequence diagrams, why do we need them and when do we use them?
- In general :
- sequence diagrams are better at showing the sequence of calls (messages)
- ommunication diagrams are better at showing links between objects/participants.
- Sequence diagrams are better for showing control logic, like loops and selection (if .. else) .
- However, Communication diagrams are easier to draw and to change quickly. Easier in brainstorming sessions (e.g. scribbling on a whiteboard). If used like this, it’s a similar technique to CRC cards.
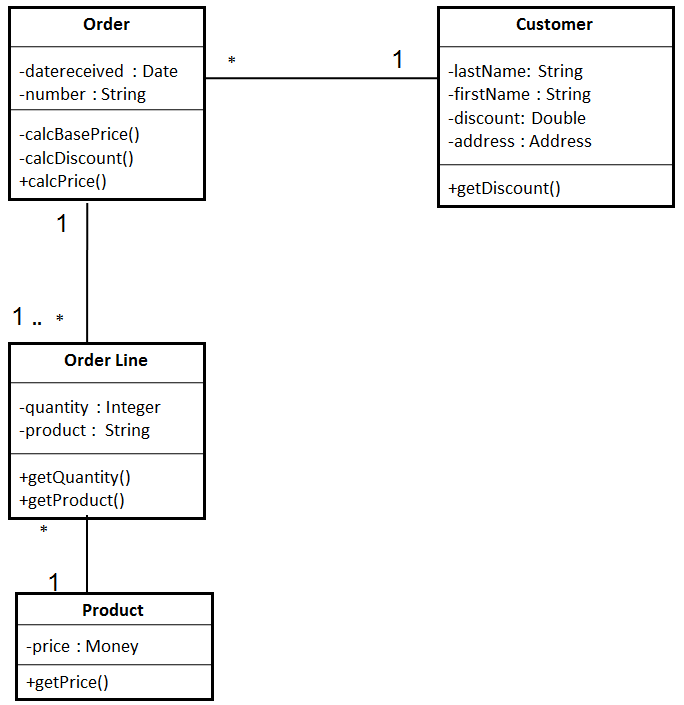
Here is the class siagram for the use case
In order to carry out the task - calculate the order price - the objects have to communicate with each other. They communicate using their operations. This is what we mean when we talk of passing messages.
Look at each class to see what information objects of the class would hold and what operations they can carry out.
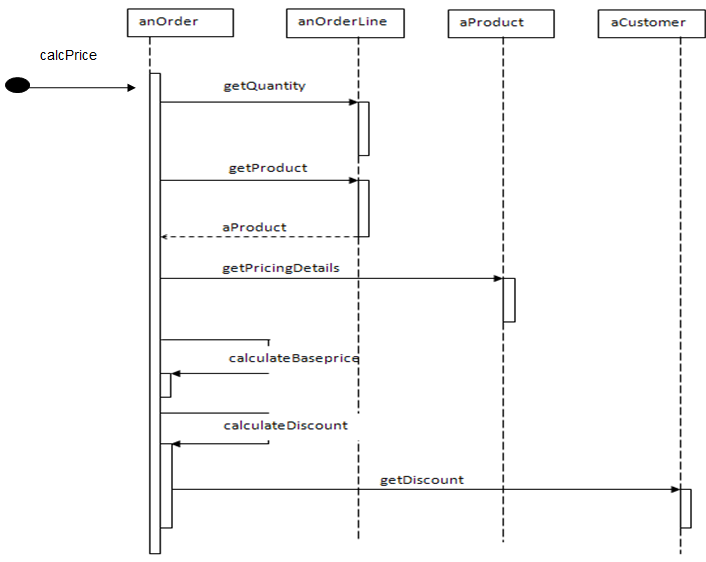
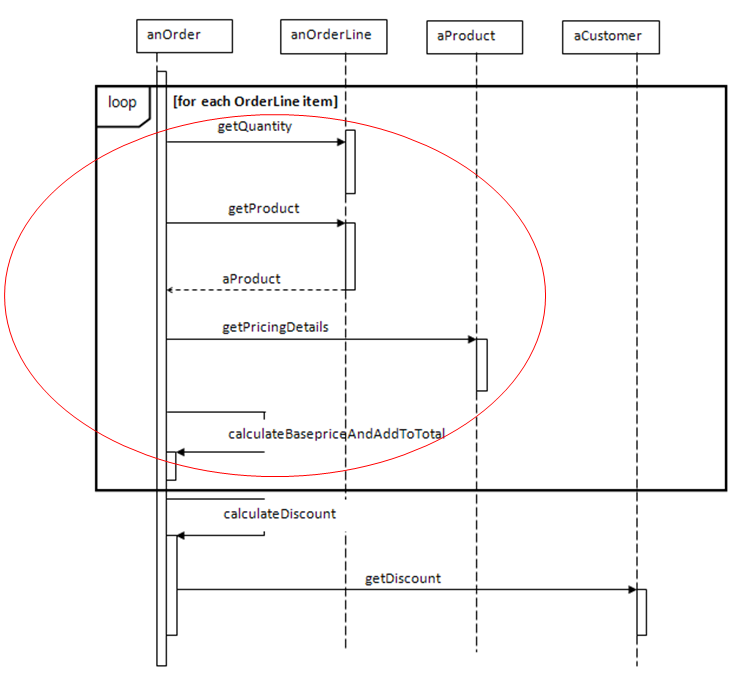
- Here is the Sequence diagram for the price calculating use case.
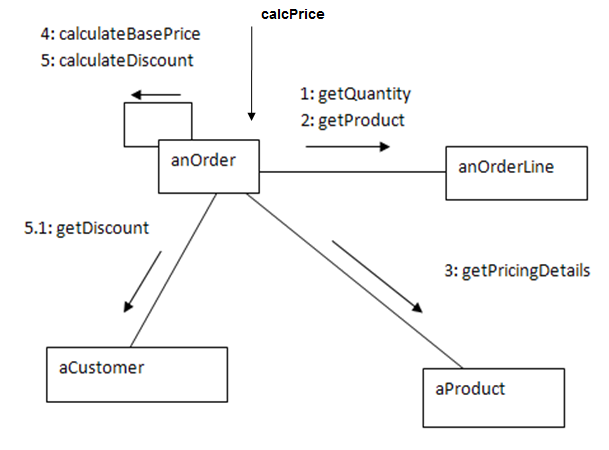
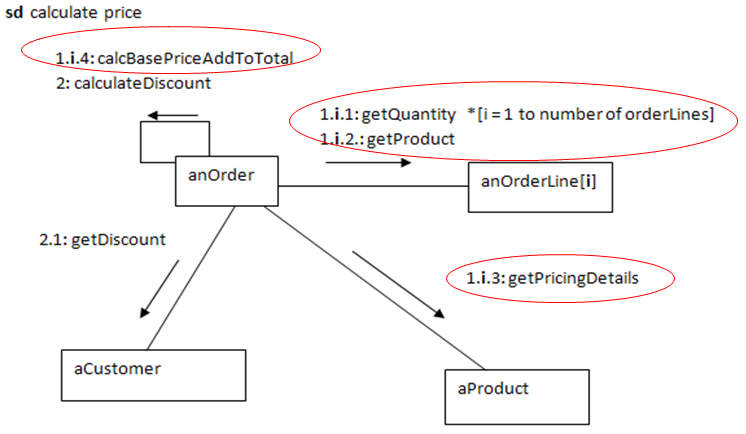
- Communication Diagram of the Calculate Order Price use case
-
Notation of Communication Diagrams
Participants
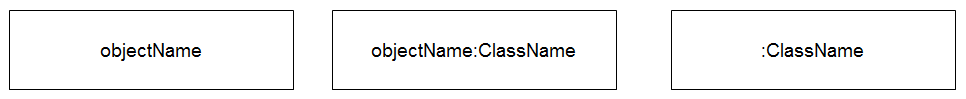
- Syntax for name of lifeline is the same as for Sequence diagrams.
Links
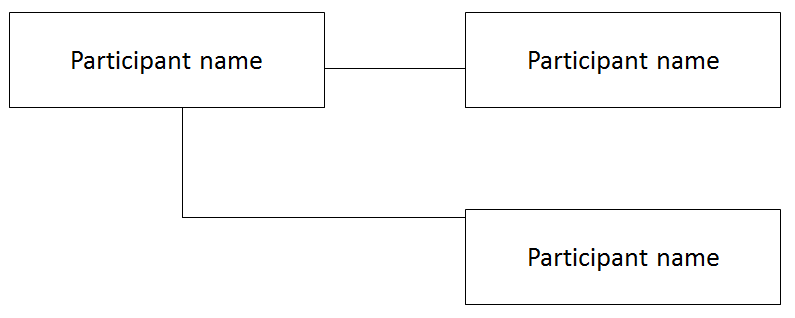
- Links are ONLY drawn on communication diagrams to support the passing of messages between the participants in the interaction
Messages
- Messages are shown by an arrow pointing in the direction that the message is sent and a label that specifies the message
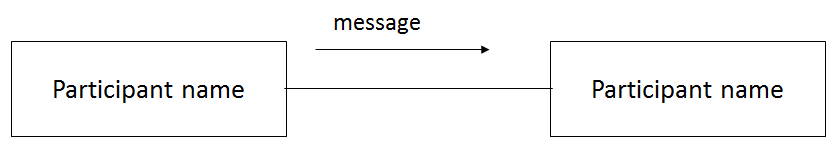
A message is the same as a message in Sequence diagrams, and is defined as a specification of the conveyance of information from one instance to another with the expectation that activity will ensue
A message may specify the raising of a signal or the call of an operation
Message may be one of the following:
a signal sent from one object to another
an operation being invoked on another object
creation/destruction of an object instance
- The arrow represents the flow of control
- The message arrows are the same as those for sequence diagrams
- Where the flow of control is synchronous there is only one thread of execution – the activity passes from one lifeline to another
- Where the flow of control is asynchronous more than one lifeline can be active at any one time
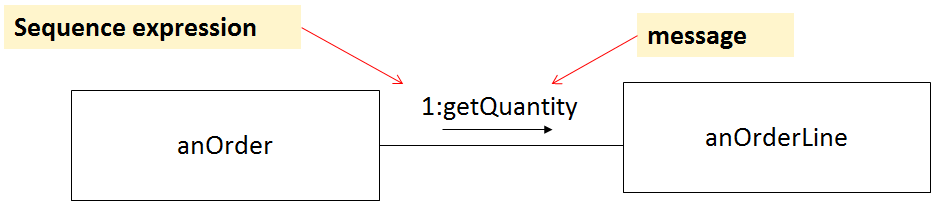
The syntax for messages is the same as that for sequence diagrams
Sequence-expression [attribute=] signal-or-operation-name [(arguments)] [:return-value]
However, the notation for communication diagrams includes the sequence-expression (a number) at the start
-
Sequence expression (numbering)
- Sequence expression defines the order in which the interactions take place
- It is a dot separated list of sequence-terms followed by a colon
- Each term represents a level of nesting within an interaction
- If an object receives an operation call numbered 1: and as a result sends an operation call to another two objects
- the operation calls will have sequence expressions 1.1: and 1.2:
Recurrence (loops)
- Used for messages that are sent iteratively or are sent depending on a guard condition
- Shown using an *
- e.g. *[while not end-of-file]
- It is equivalent to a loop combined fragment in a sequence diagram
Communication Diagram of the Calculate Order Price use case With recurrence
How to produce Communication diagrams
- Decide on the context of the interaction: system, subsystem, use cases or operation
- Identify the structural elements (objects, subsystems) necessary to carry out the functionality of the interaction
- Model the structural relationships between those elements to produce a diagram showing the context of the interaction
- Consider the alternative scenarios that may be required
- Draw communication diagram
StarUML
- A Communication (Collaboration) Diagram can be easily created from an existing Sequence Diagram :
- Select Sequence Diagram in Model Explorer
- From Main Menu :
- Model -> Convert Diagram -> Sequence to Collaboration
- Tidy up Diagram – using drag-and drop
-
Other Types of Interaction Diagrams
- Timing Diagrams
- Interaction Overview Diagrams
Interaction Diagrams
- In UML – there a FOUR types of Interaction Diagrams :
- Sequence Diagrams
- Communication Diagrams
- Timing Diagrams
- Interaction Overview Diagrams
Timing Diagram
- A Timing Diagram is a specific type of interaction diagram, where the focus is on timing constraints.
- Timing diagrams are used to explore the behaviours of a single object or a collection of objects throughout a given period of time.
- A timing diagram is a special form of a sequence diagram.
- The differences between timing diagram and sequence diagram are the axes are reversed so that :
- time is increased from left to right
- lifelines are shown in separate compartments arranged vertically.
- Timing Diagrams are not frequently used
Example
- Let's take a simple scenario based on the pump and hotplate for a coffee pot.
- Let's imagine a rule that says that
- at least 10 seconds must pass between the pump coming on and the hotplate coming on.
- When the water reservoir becomes empty :
- the pump switches off
- and the hotplate cannot stay on for more than 15 minutes more.
- 📷 Ex. 1 - Showing States as Lines
- 📷 Ex. 2 - Showing States as Areas
- Both of these examples illustrate alternative ways of showing the timing constraints.
- Both diagrams show the same basic information.
- The main difference is :
- Ex. 1 shows the state changes by moving from one horizontal line to another
- Ex. 2 retains the same horizontal position but shows state changes with a cross.
- The style of Ex. 1 works better when there are just a few states, as in this case, and Ex. 2 is better when there are many states to deal with.
X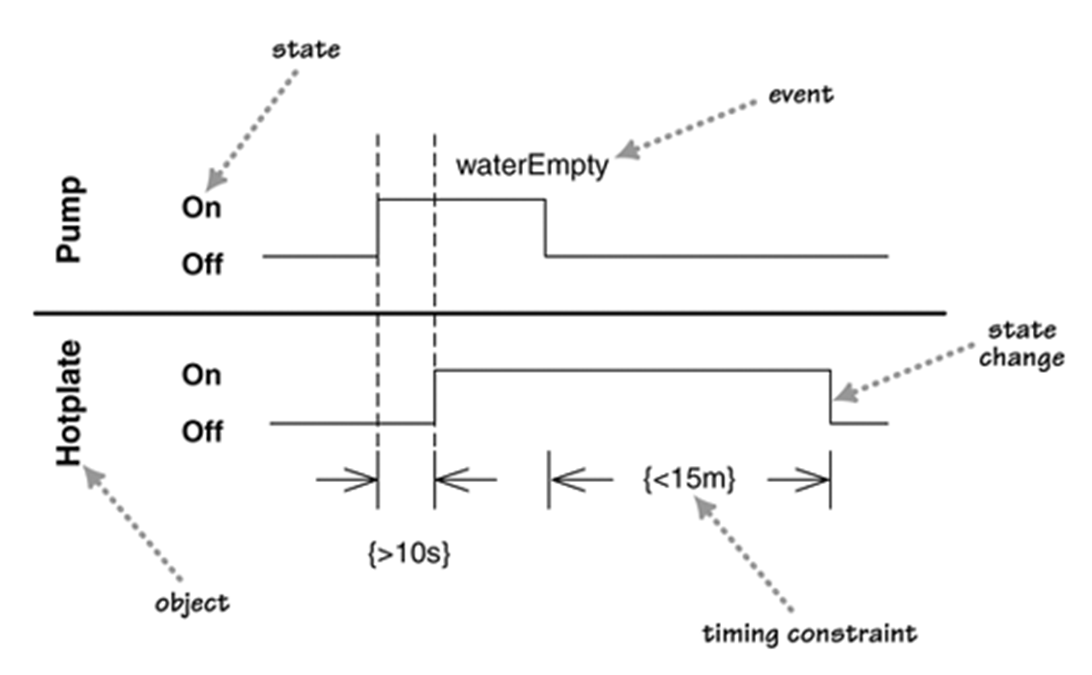 X
X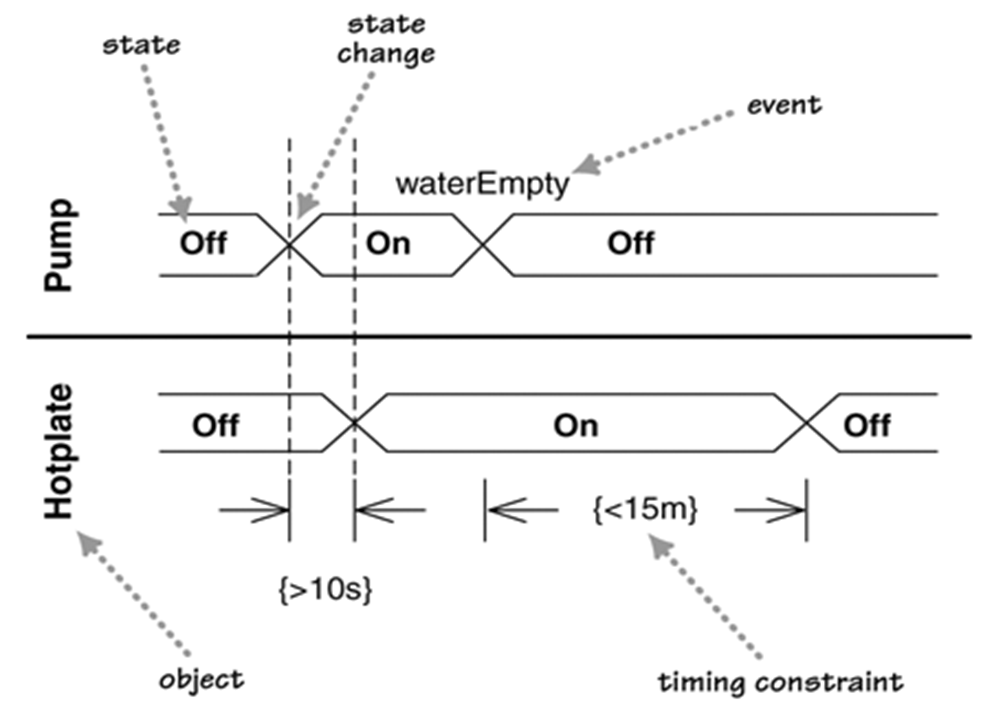
-
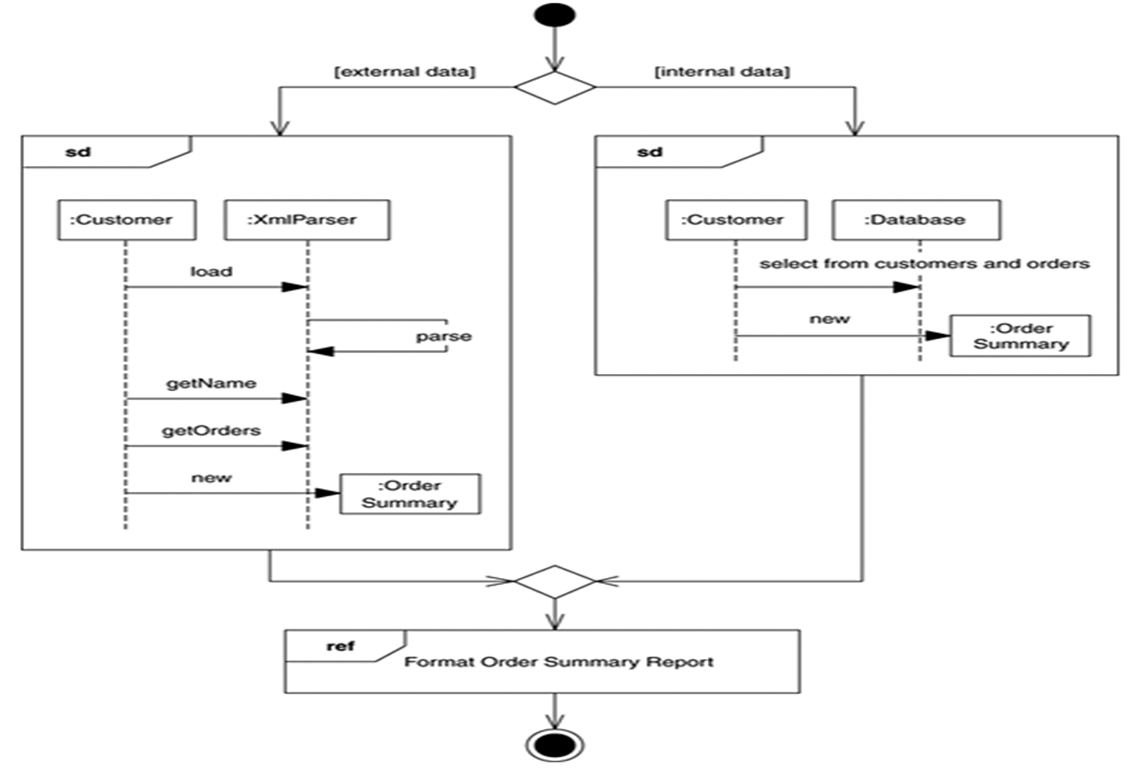
Interaction Overview Diagrams
- Interaction overview diagrams are a grafting together of activity diagrams and sequence diagrams.
- They are used to model the high level flow of control between interactions
- You can think of interaction overview diagrams either as :
- activity diagrams in which the activities are replaced by small sequence diagrams
- or
- as a sequence diagram broken up with activity diagram notation used to show control flow.
Example
Example - Description
- The notation is familiar – it uses activity diagrams and sequence diagrams
- In this Example , we want to produce and format an Order Summary Report :
- If external customer - we get the information from XML
- if internal customer - we get it from a database.
- Small sequence diagrams show the two alternatives.
- Once we get the data, we format the report; in this case, we don't show the sequence diagram but simply reference it with a reference interaction frame.
StarUML videos
- Sequence Diagram Video available
- Also, a video which covers the following :
- Producing Collaboration Diagrams from Sequence Diagrams ( for information)
- State Machine Diagrams (for coursework)
- Printing Diagrams from StarUML (for coursework )