-

-
Lecture 1 – Poisson Distribution, Gaussian Distribution, z-score
- How horse kicks in Prussian army influenced statistics (Poisson Distribution)
- Gaussian Distribution (binomial and Poission can be approximated with Gaussian distribution)
- z-score
-
Poisson Distribution
The Poisson distribution is popular for modelling the number of times an event occurs in an interval of time or space.
Named after French mathematician Siméon Poisson.
The Poisson random variable X with parameter λ > 0 which equals the average number of events in an interval is given by the probability mass function: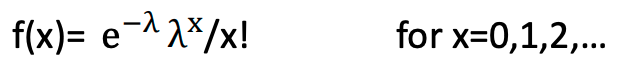
Parameter λ is also known as a rate parameter
Poisson Distribution: Mean and Variance
For the Poisson random variable X with a rate
parameter λ, the mean is
μ = E[X] = λ
and variance is
σ2=V[X] = λ
The mean and variance of the Poisson random variable are the same!
Poisson Distribution: history and applications
Ladislaus Bortkiewicz published a book at the end of the 19th century which contained data about the number of soldiers killed by being kicked by a horse each year for several Prussian cavalry corps.
Author showed that the data followed Poisson distribution and, more generally, that events with low frequency in a large population tend to follow a Poisson distribution which hugely popularised use of the distribution
Photon counting, reliability engineering, number of phone calls, number of customers are some of phenomena modelled with Poisson
Example: Poisson distribution
Assume the number of customers follows a Poisson distribution with a mean of 17 customer per day. Find the probabilities of having exactly 10 and 17 customers in one day.
- Click here for solution
Example: Poisson distribution (2)
Assume the number of customers follows a Poisson distribution with a mean of 17 customer per day. Find the probabilities of having at least one customer.
- Click here for solution 2
Solution
Answer:
Let X denote the number of customers in a day.
P(X=10)= e−17 1710/10! =0.023
P(X=17)= e−17 1717/17! =0.0963Solution
Answer: P(X>0)=?
Remember: f(x)= e−λ λx/x! for x=0,1,2,…
P(X>0)= e−17 17 /1! + e−17 172/2! +…
But this is infinite summation!
Complement: P(X>0)= 1-P(X=0)= 1 − e−17 -
Gaussian Distribution
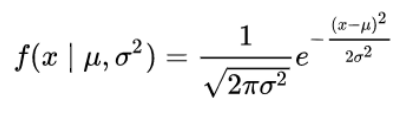
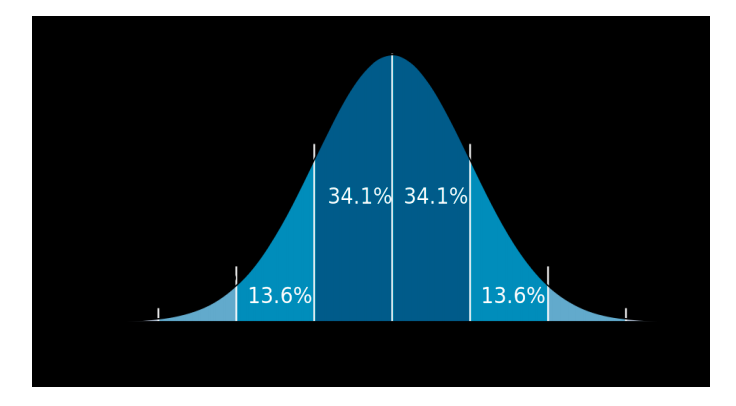
Gaussian (Normal) Distribution
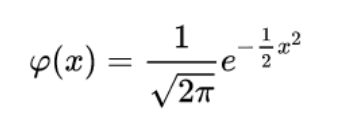
Standard normal distribution with zero mean and variance equal to one:
Z-score
Z-score represents the signed number of standard deviations by which the value of the data point is above the mean of the observed random variable.
Z-score is positive if above the mean and negative if below it: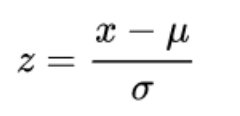
In Matlab, use qfunc to compute complementary cumulative distribution function
Matlab
- Use randn to generate Gaussian random variable
- Use qfunc to find complementary cumulative distribution function
- Use zscore to find the z-score of random variables
Example with zscore and Gaussian distribution
Suppose X is a random variable that has normal distribution with mean = 4 and standard deviation (SD) = 2.
Do the following:
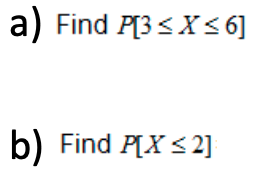
- Click here for solution
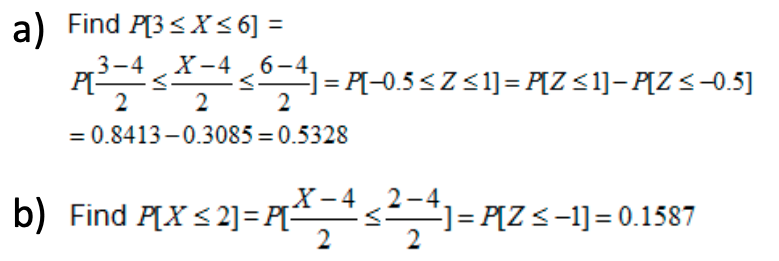
Solution
- Insert Content Here 5
- Insert Content Here 6
- Insert Content Here 7