-
Dr Azmy Gowaid
School of Computing, Engineering and Built Environment
Glasgow Caledonian University
Email: azmy.gowaid@gcal.ac.uk -
Preparation for the Exam
- The past papers: do not just rely on pastpapers!
- Review the lecture slides
- Review the tutorial questions
- Past papers can be a supplementary excise after you have done the previous two
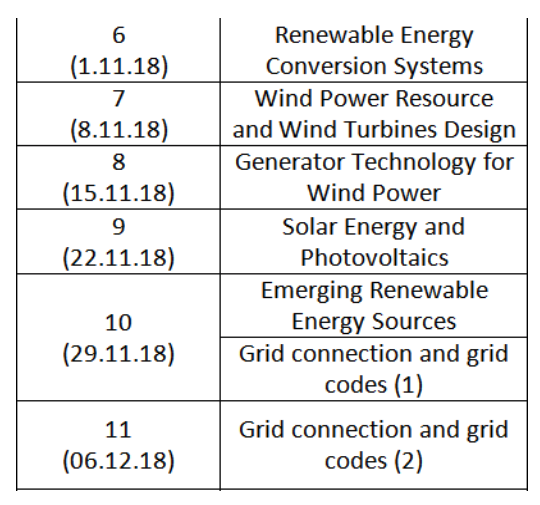
Lectures Schedule
-
Renewable Energy status and outlook in the UK and worldwide
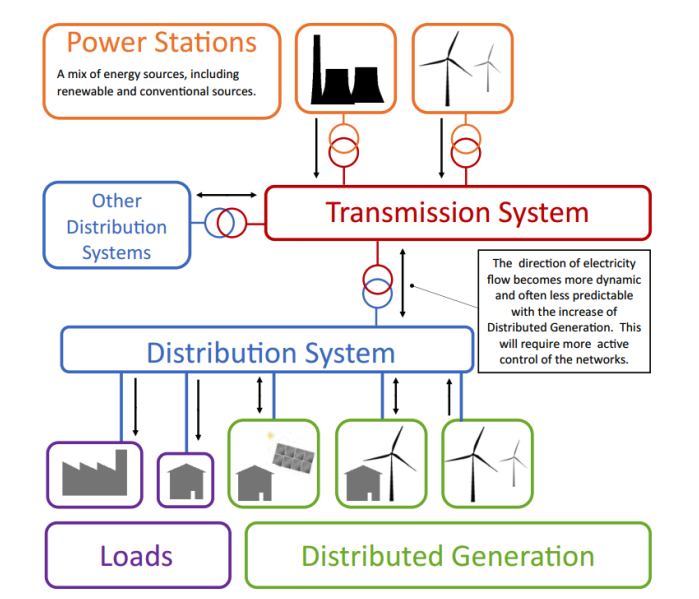
Modern Power Grid Structure
Share of Global Installed Power
- Global installed power capacity reached over 6.4 Terawatts (TW) in 2016 from over about 5 TW in 2010 at a compound annual growth rate of 4.1%. (1TW=1000GW)
- Thermal-based power plants (e.g. coal-fired, gas, nuclear) account for over 61% of global installed capacity.
- Hydro power plants account for about 19% of global installed capacity.
- Total renewable energy installations are about 1TW accounting for about 15% of global capacity.
- Wind power share is over 8%, solar power share is over 5% of global installed capacity
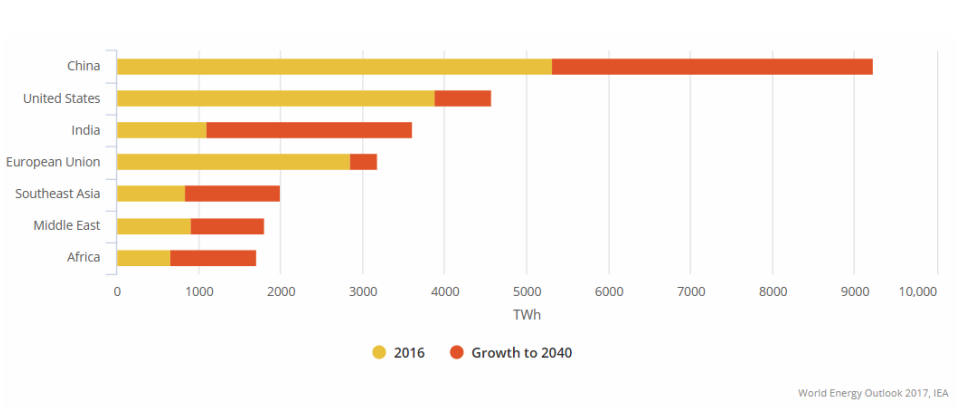
Electricity Demand Projections
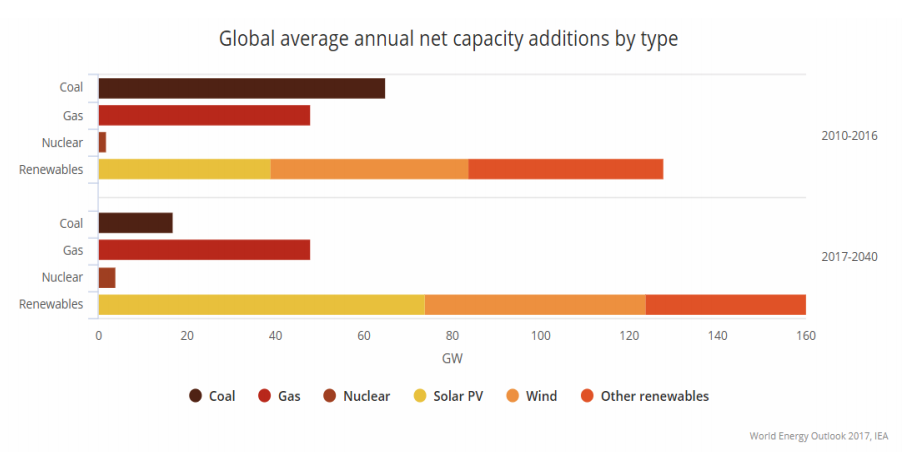
Global Capacity Additions (2016)
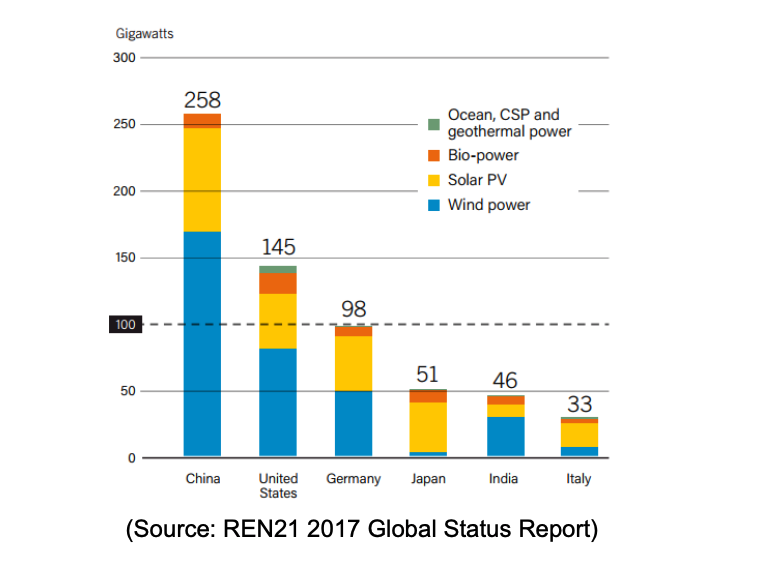
Top 5 countries in RE Capacity
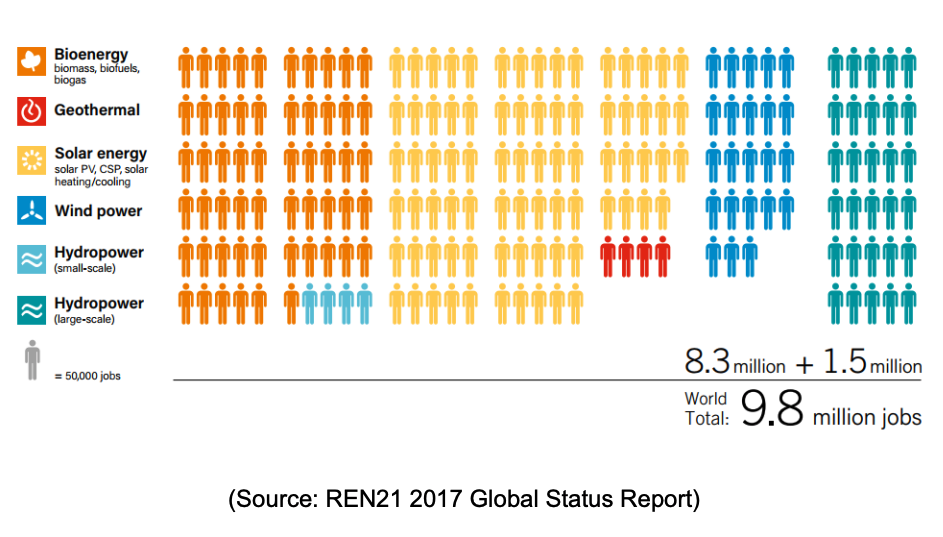
Jobs in RE sector globally (2016)
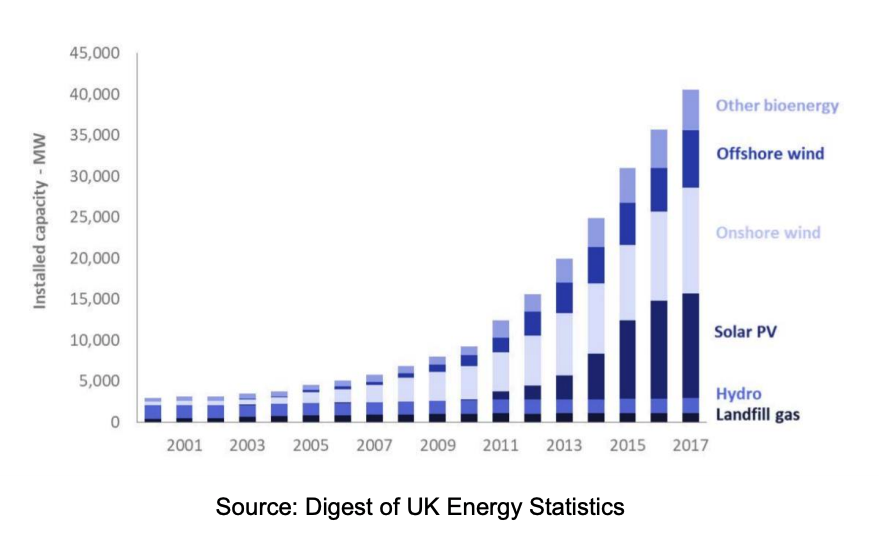
UK RE installed capacity
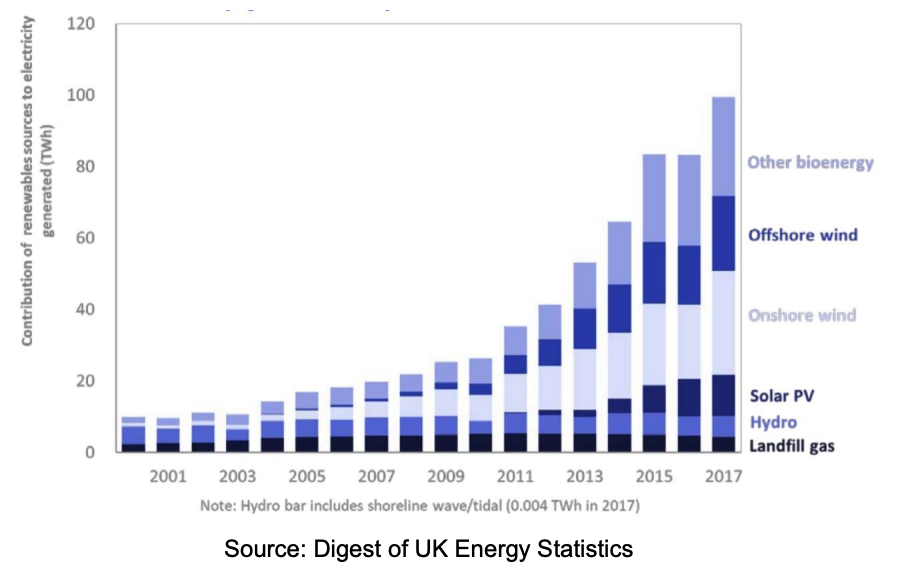
UK RE Generated Electricity
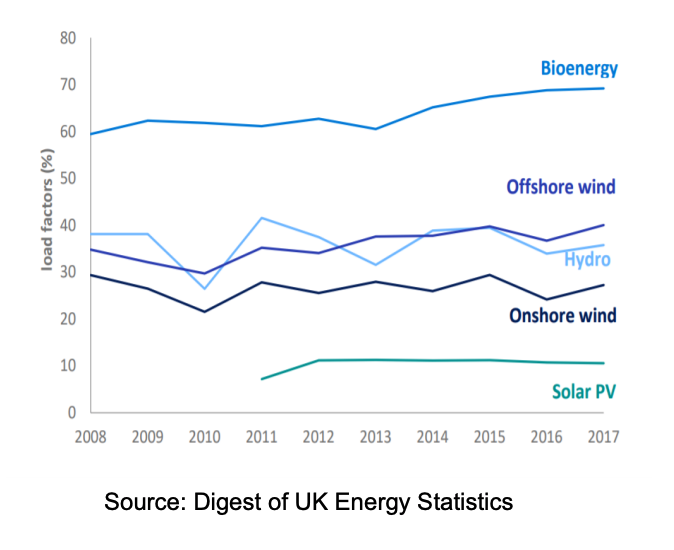
UK RE Plants Load factors
Load Factor is defined as the ratio of average load (in MW) to the maximum power output (in MW).
Or it is the ratio of the actual generated energy (in MWh) to the maximum energy it could generate if operated continuously at maximum demand.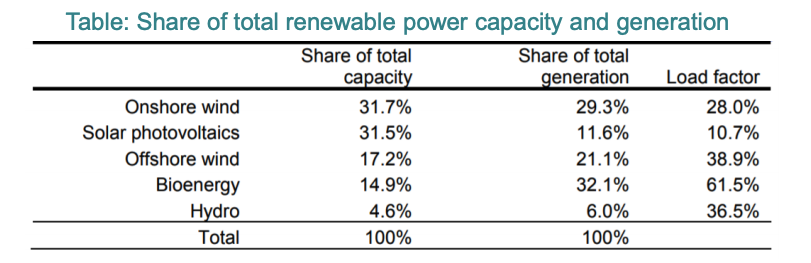
- Solar PV held the second highest share of RE capacity in 2017 at 31.5%. However, due to the low load factor for solar PV in the UK, its share of generation was just 12%.
- Bioenergy showed the fourth lowest share of capacity (15%) but the highest share of generation (32%). The load factor for bioenergy is correspondingly high.
-
Governmental Incentive Programs
Renewable Energy Certificates
- Renewable Energy Certificate (REC) is a concept brought forward by regulators to incentivise the installation of more renewable energy plants by requesting licensed electricity suppliers to buy a certain percentage of their supply from eligible renewable generation plants.
- When a renewable energy generator — a wind farm or solar power plant, for example — generates a megawatt-hour (MWh) of power, it receives one REC, a certificate saying that it generated one MWh of electricity from clean sources, which it can also sell in the open market.
- This means every renewable generator has two revenue streams, electricity sold at prevailing market rates, and REC sold at rates set by the regulator (normally updated annually).
- Suppliers prove compliance to the regulator by presenting a sufficient number of RECs to cover their obligation.
- Suppliers can purchase RECs directly from renewable power plants, or from other suppliers. So, RECs is in reality a commodity.
- RECs are also known as Green Tag, Tradable Renewable Certificates (TRCs). It is known as Renewable Obligation Certificates (ROCs) in the UK
- In the UK, ROCs are regulated, issued, and managed by Ofgem in line with the Renewable Obligation (RO) legislation.
- Ofgem: In the UK, the Office of Gas and Electricity Markets regulates the companies which run the gas and electricity networks. It takes decisions on price controls and enforcement, acting in the interests of consumers and helping the industries to achieve environmental improvements.
Feed-in Tariff (FiT)
- Feed-in Tariffs (FiT) are a fnancial incentve to support distributed and small-scale renewable energy generaton (up to 5 MW in the UK).
- The FiT incentives are present in over 50 countries worldwide.
- FiT is available for the following generation technologies:
- Wind power - Solar PV power
- Hydro power - Anaerobic digestion
- Micro-CHP (≤ 2kW)- FiTs were announced in the UK in October 2008 and took effect from April 2010
- The Department of Business Energy and Industrial Strategy (BEIS) stated their intention to close the FiT scheme to new applicants (new installations) from 1 April 2019 and will not be replaced by a new subsidy.
Feed-in Tariff (FiT) in the UK
- Tariffs are adjusted annually for inflation. An eligible generation project will continue to receive FiTs for the eligible lifetime of the project (20 years for most technologies).
- There are three sources of financial benefit from a generation project receiving FiTs:
◇ Generation tariff:
A fixed price for each unit of electricity generated by the renewable system.
◇ Export tariff:
A guaranteed price for each unit of electricity exported to the grid.
◇ Import reduction:
Reducing your import from the grid by using your own electricity.
Feed-in Tariff (FiT) in the UK
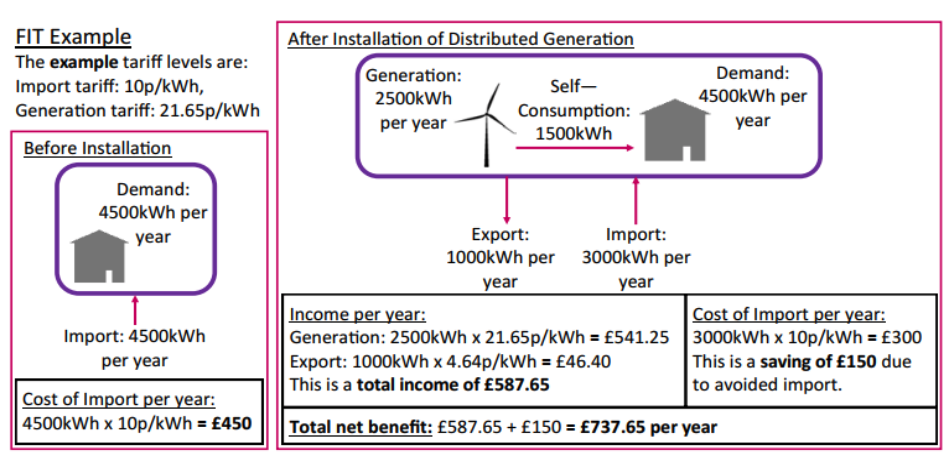
In this example a smart (bidirectional) meter was used to record exported power. When no such meter is installed, it is assumed that 50% of generated power is exported to grid.
Repeat the previous example to see how much net benefit the owner gets in this case?
Carbon Credits (Carbon Emissions Trading)
- Incentive program for the industrial and commercial sectors to reduce greenhouse-gas (GHG) emissions.
- Different versions of this program are in operation in many countries and regions in coordination with the Kyoto Protocol.
- Countries set quotas on the emissions of industrial and commercial installations, generically termed 'operators‘.
- Each operator has an allowance of credits, called “carbon credits”, where each unit gives the owner the right to emit one metric tonne of carbon dioxide or other equivalent greenhouse gas.
- Carbon Credit is a permit that allows the holder to emit one ton of carbon dioxide which can be traded in the international market at their current market price.
- I Operators that have not used up their quotas can sell their unused allowances as carbon credits, while businesses that are about to exceed their quotas can buy the extra allowances as credits, privately or on the open market.
- For example:
- You are a business that cannot reduce GHG emissions to the regulated target. You will have according to the regulations to pay another business to purchase Carbon Credits
- In reality you buy the carbon emissions they saved so that eventually the total sum of emissions produced by both businesses is the same.
- With a pool of businesses, this is an open market where businesses trade carbon credits such that the national emissions cap is not breached. -
Impact of Renewables Grid Connection
Voltage Stability Under Grid Faults
- Grid faults can lead to voltage dips due to the high fault currents flowing through the circuit.
- Generators:
Supply reactive power → voltage rise
Absorb reactive power → voltage dip- Conventional power plants use synchronous generators which can supply sufficient reactive power to restore the voltage (i.e. low voltage stability risk)
- Renewable generation is interfaced to the grid using power converters with low reactive power capability + may employ induction machines (as in wind energy) absorbing reactive power during voltage dips.
- This leads to further voltage depression (i.e. higher voltage stability risk)
Voltage Stability Under Grid Faults
- At low voltage, generators cannot push enough electric power into the power grid.
- Wind turbines accelerate under the unbalance between mechanical power input and electrical output. They may be exposed to overspeeding or overcurrents. Hence, need disconnection.
Solution
Regulations enforced on renewable energy plants to ensure they can adequately support the grid during faults. These regulations are called Grid Codes.
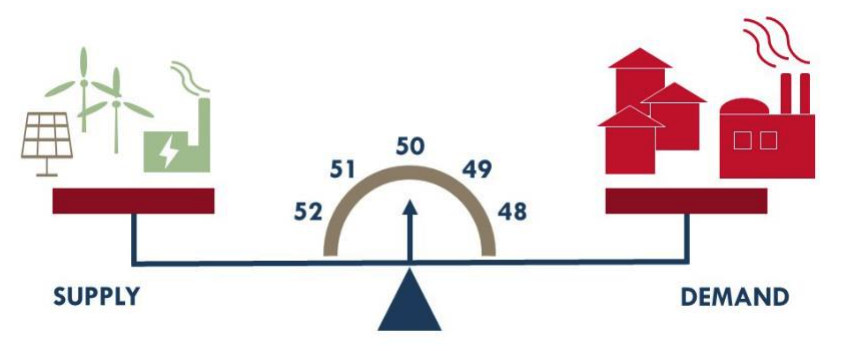
Frequency Stability Under Demand/Supply Imbalance
- Grid frequency (generators rotating speed) must be kept in the vicinity of the nominal value (50Hz in the UK) to avoid failure of loads (mainly motor-based) and power plants.
- Grid frequency stability is subject to balance between demand and supply
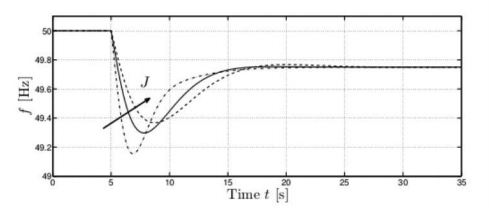
- The rate of change of frequency (ROCOF) depends on power system inertia.
- • Higher system inertia means lower ROCOF and eventually smaller frequency swing (and vice versa).
Frequency Stability Under Demand/Supply Imbalance
- Conventional generation is controllable and easy to plan output power ahead of operation to meet forecasted demand by loads.
- Most renewable generation is stochastic in nature due to the intermittency of renewable resource (wind, solar, etc)
- Renewable power sources interface to the grid via power converters, reducing overall system inertia.
- With lower inertia, sudden supply/demand imbalance leads to wider frequency swings.
Problem
Higher penetration of renewable energy into power systems reduce ability to meet forecasted demand and reduce overall system inertia. Thus deteriorates grid frequency stability.
Solution
• Regulations in Grid Codes as to how renewables can support grid frequency similar to conventional generation
• Control renewable generation systems to provide synthetic inertia.
• Reduce intermittency by dispersing renewable generation across wide geographical area
• Power balancing of the input power using energy storage systems
Power Quality Problems (Harmonics)
Problem
Inverters when converting from DC into AC may produce a square wave or modified sine wave with high harmonic content.
Voltage frequencies not at 50Hz can affect equipment, loads and motor efficiency.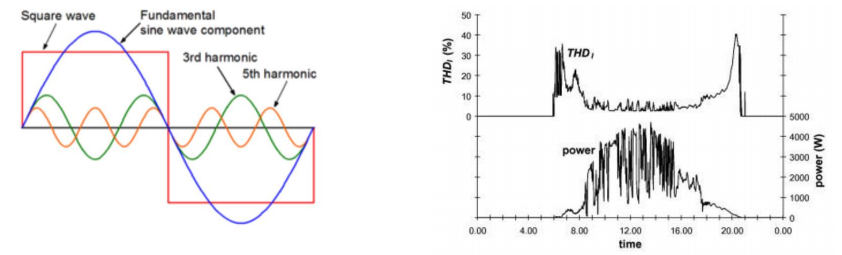
Solution
More sophisticated inverters and filtering. Grid codes limit total harmonic content.
Power Quality Problems (Flicker)
Problem
Incandescent light bulbs „flicker‟ annoyingly when voltage levels vary at 8Hz. Fixed speed wind turbines with slow pitch regulation are prone to this since gusts of wind are passed on to the network as changes in active and reactive power.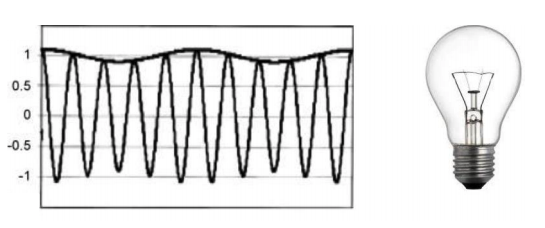
Solution
Strengthen grid connection and use of variable speed wind turbines. -
Solar Energy Outlook
Photovoltaic Solar Power
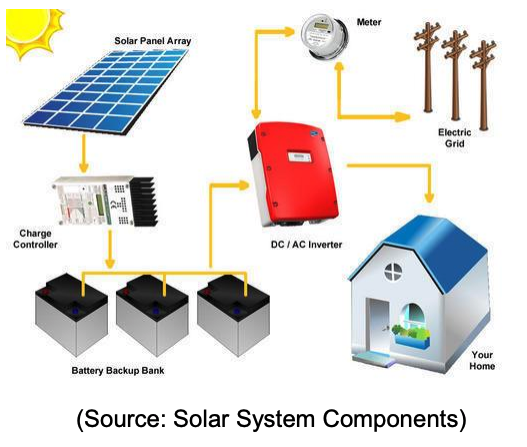
- Mainly used in residential and small-to-medium scale commercial sector.
- Typical small scale system consists of panels connected to mains through a dc/ac inverter and a meter.
Batteries can be included along with a charge controller unit.
- Several Utility scale PV projects in many countries (Example: Bhadla Solar Park, India – 1365MW)
Photovoltaic Solar Power
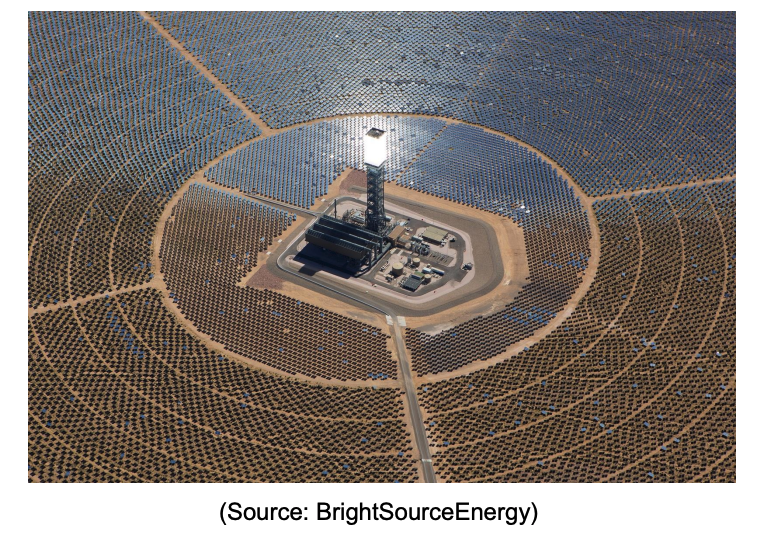
Concentrated Solar Power (CSP)
Solar Tower Power Plant
A large number of flat, sun-tracking mirrors, known as heliostats, focus sunlight onto a receiver at the top of a tall tower. A heat-transfer fluid heated in the receiver is used to heat a working fluid, which, in turn, is used in a conventional turbine generator to produce electricity.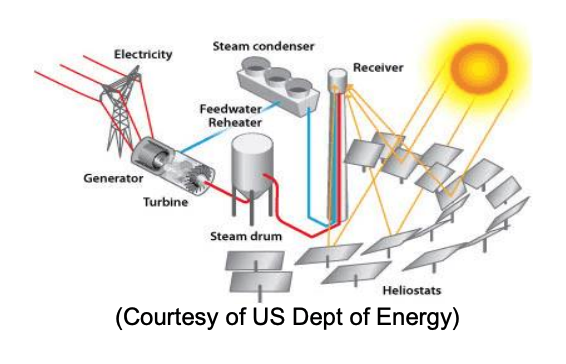
Concentrated Solar Power (CSP)
The Ivanpah solar power plant, California, US (392MW)
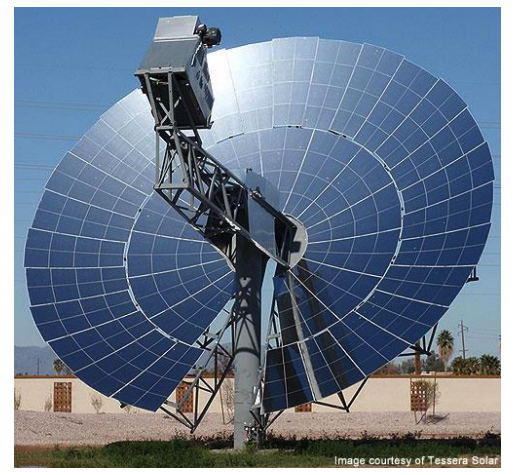
Parabolic Dish Power Plant:
- A parabolic dish of mirrors is used to direct and concentrate sunlight onto a central engine that produces electricity.
- Produces smaller amounts of electricity than other CSP technologies
- Typically in the range of 3 to 25 kW but is beneficial for modular use
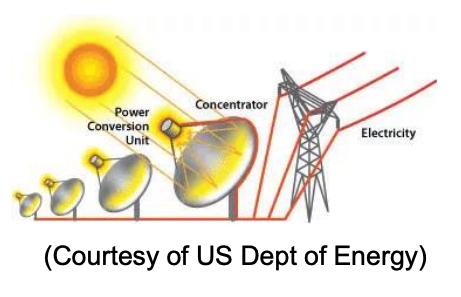
The Maricopa solar power plant, Arizona, US (60 Dishes each 25kW summing up to 1.5MW)
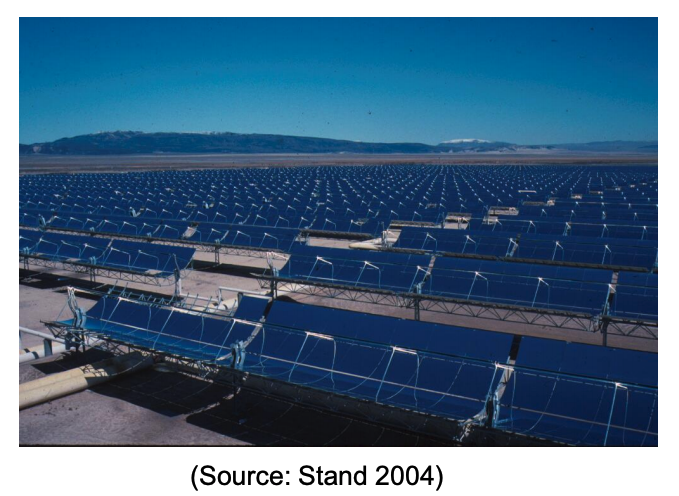
Parabolic Trough Power Plant:
Many parallel rows of linear collectors capture the sun's energy with large mirrors that reflect and focus the sunlight onto a linear receiver tube. The receiver contains a fluid that is heated by the sunlight and then used to heat a traditional power cycle that spins a turbine that drives a generator to produce electricity.
Alternatively, steam can be generated directly in the solar field, which eliminates the need for costly heat exchangers.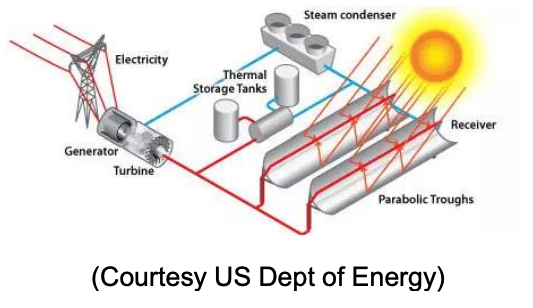
The SEGS solar power plant, California, US (354MW)
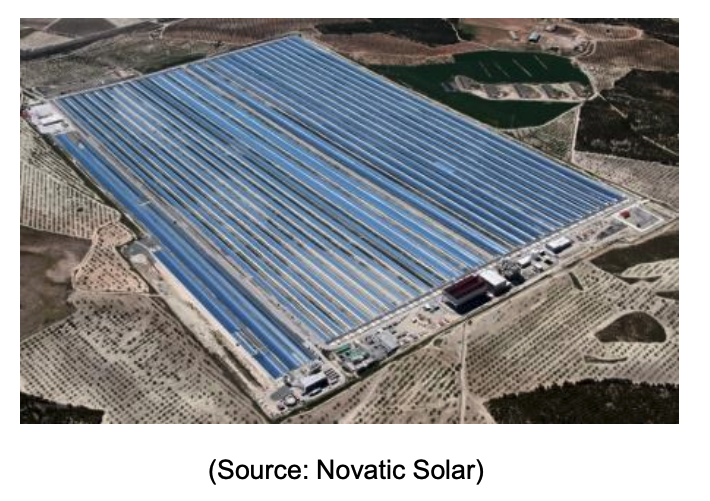
Solar Fresnel Power Plant:
Another type of linear concentrator technology is the linear Fresnel reflector system. Flat or slightly curved mirrors mounted on trackers on the ground are configured to reflect sunlight onto a receiver tube fixed in space above the mirrors. A small parabolic mirror is sometimes added atop the receiver to further focus the sunlight.
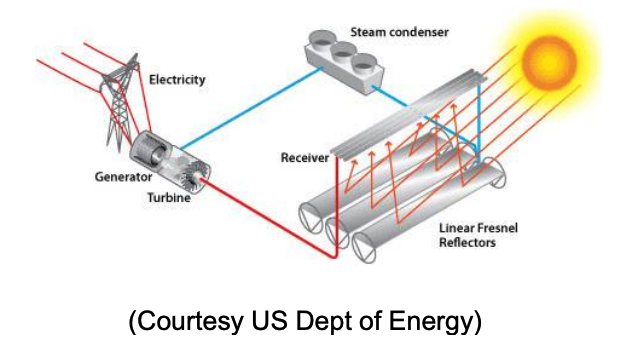
Puerto Errado 2 Solar Fresnel Power Plant, Spain (30MW)
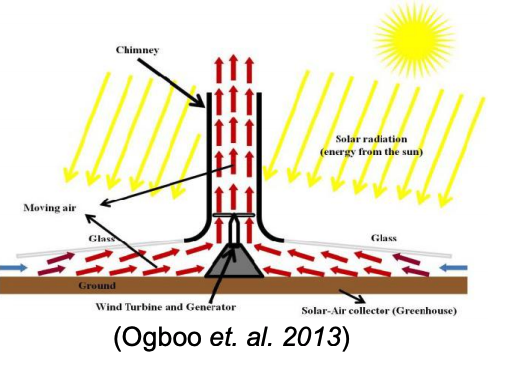
Solar Chimney Power plants
Sunshine heats the air beneath a very wide greenhouse-like roofed collector structure surrounding the central base of a very tall chimney tower (Uplift Tower). The resulting convection causes a hot air updraft in the tower by the chimney effect. This airflow drives wind turbines, placed in the chimney updraft or around the chimney base, to produce electricity.
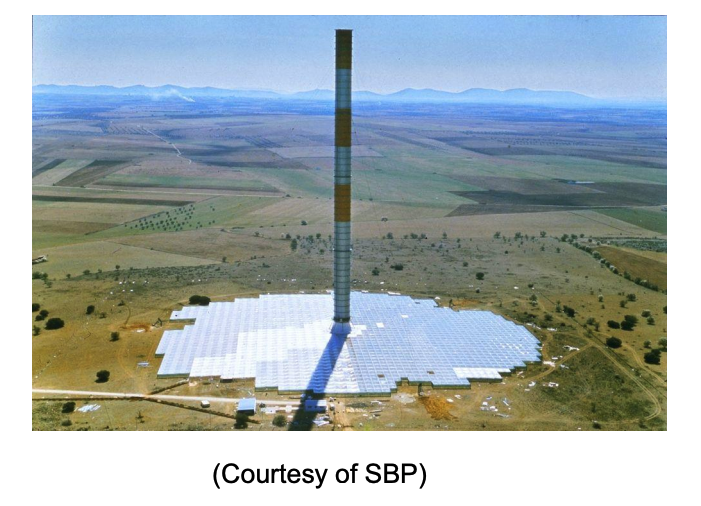
Concentrated Solar Power (CSP)
Manzanares Prototype Solar Chimney Power Plant (50kW)
-
Wind Energy Outlook
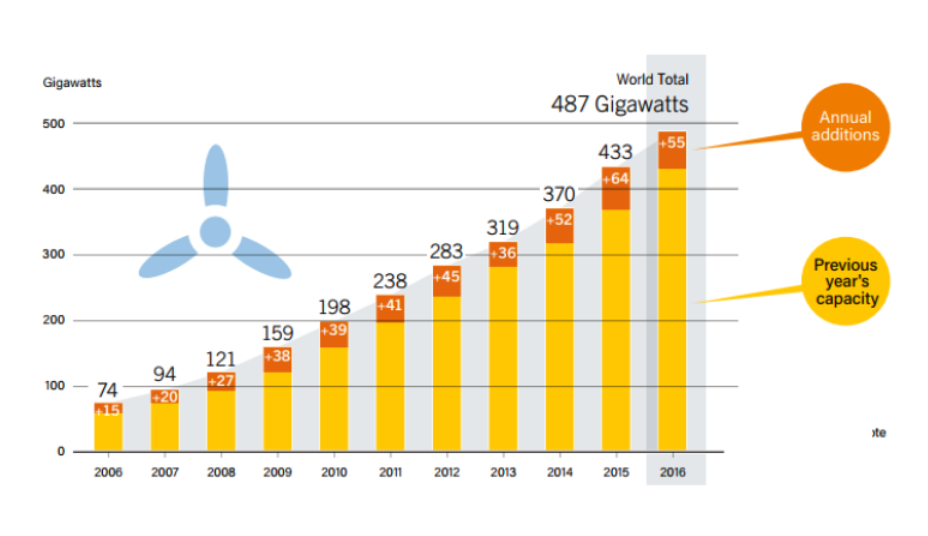
Incremental Wind Installations
Incremental Offshore Wind Installations (Global)
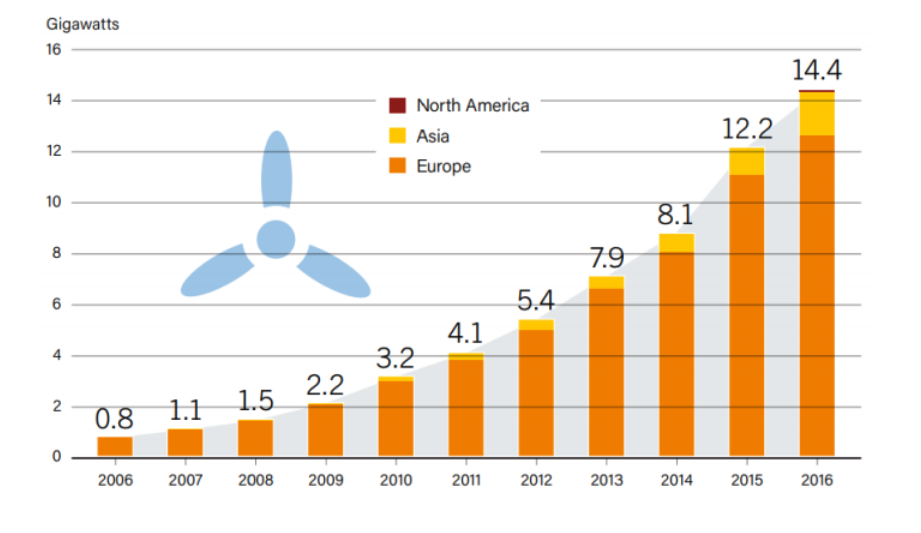
Notice very little offshore wind installations in North America and Asia. Why?
Incremental Wind Installations (by Country
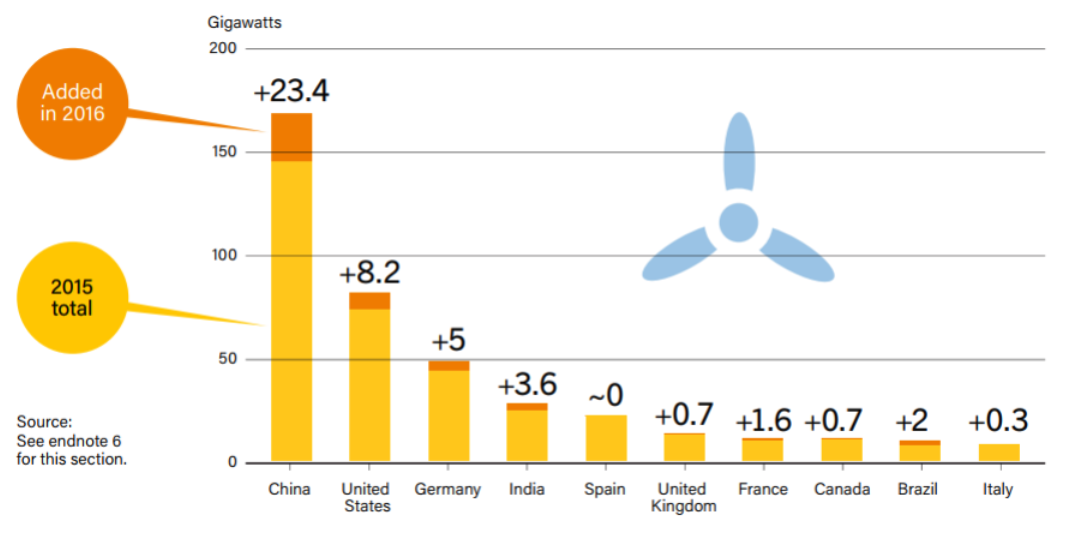
China and US top 2 countries in incremental installed wind power per annum.
Wind power penetration level
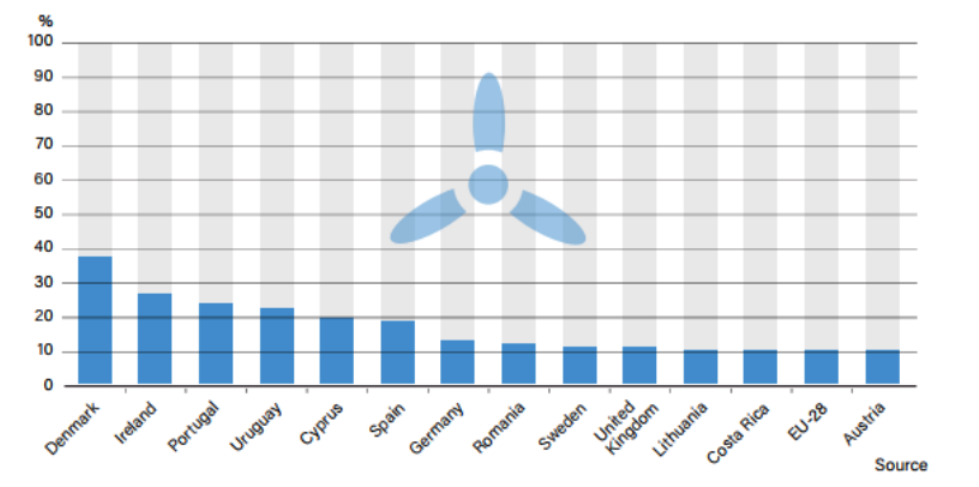
- Wind penetration level is the ratio of installed wind power generation to the total installed power generation in a power system.
- Denmark and Ireland top 2 countries in wind penetration level. Where are China and US?
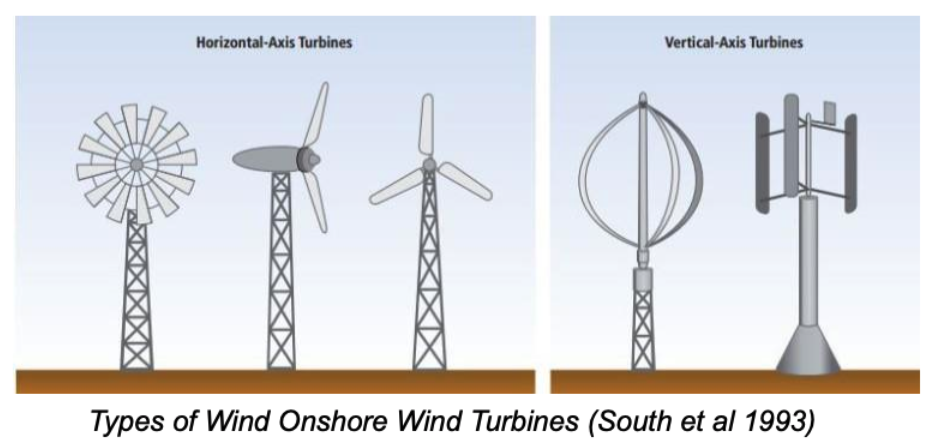
Evolution of Wind Turbines
Horizontal axis (HAWT) and vertical access (VAWT)
-
Other Renewable Energy Sources
Biomass Energy
- Biomass, is a renewable energy source made of biological material from living, or recently living organisms.
- Energy is released by combustion (burning).
Advantages
• Produces less pollution than fossil fuels.
• Does not cause acid rain.
• Can be found locally.
• It is renewable.
Disadvantages
• Inefficient (only 30% efficiency).
• Releases harmful solid carbon particles into the atmosphere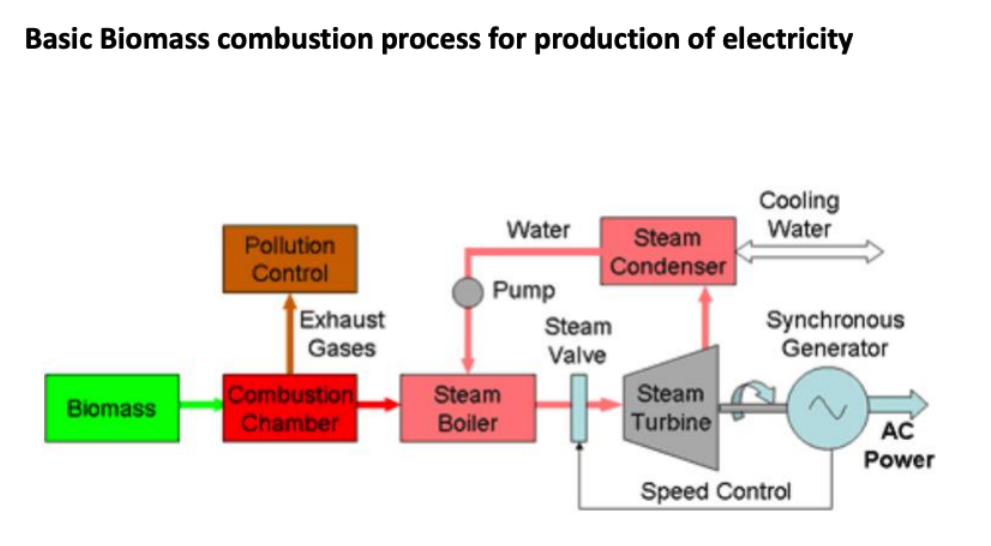
Nuclear Energy
- Radiation is released from the nuclei of metal atoms.
- Resultant heat drives a steam cycle to generate electricity
- 448 operable nuclear power plants globally with 392GW power.
Advantages
• Green House gases are not made.
• Only a small amount of fuel is needed to create a lot of energy.
Disadvantages
• Harmful radioactive waste is created.
• Non-renewable, albeit being a green source of energy.
• Radiation leaks (albeit being rare) cause adverse contamination to environment and high health risks.
Wave Power
- In 2000 the world's first commercial Wave Power Device was installed in Scotland and connected to the National Grid.
- It used oscillating water column to drive air in and out of a pressure chamber through a generator.
- In 2008, the first experimental multi-generator wave farm was opened in Portugal
Advantages
• Waves are free and will not run out.
• Wave power does not produce greenhouse gases.
• There are very few safety risks.
Disadvantages
• Small waves generate small amounts of electricity. • Larger power system are further from shore and electricity transportation needed. • The equipment is expensive (submerged/floating in water)
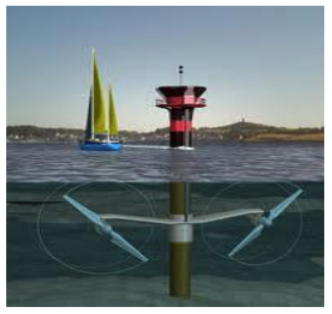
Tidal Power
- Use of daily tide flow to generate electrical power through rotary turbine blades or other mechanisms.
Advantages
• Tides are free and will not run out.
• No greenhouse gases are produced.
• It is reliable because we know exactly when the tides happen.
Disadvantages
• A dam to make the water flow through the generators might be needed.
• Plants and animals that live nearby might get harmed
• The tides only happen twice a day, so can only produce electricity at that time -
-