-
Guidance of study for Week 9
(i) Please review 9.1 to 9.3 inclusive and the reference notes for this week 9 is taken from Chapter 5, “Renewable Energy”. Also contained within the folder ”Learning Resources” of GCU learn.
(ii) “Quiz No: 3 Management of Natural Resources” is available within the “Quizzes” folder of GCU learn. Use of the internet is permissible in answering these multiple choice questions.
(iii) Task 5 and Task 6 should now be attempted
(iv) Tutorial questions to be attempted.
Any problems / questions. Please contact your tutor. -
- 9.1 Wind Energy
- 9.1.1 Introduction
Wind power has a great potential to supply the globe with electricity. We need to have three hundred thousand nuclear power stations on earth to generate as much power as what global wind can produce!
According to the “Brighter Africa” report by McKinsey&Company in 2015, it was estimated that there is a potential of 109 GW of wind capacity that can be exploited in Sub-Saharan Africa. In the UK, one of the best locations for wind power in the world, the operational wind capacity was 16.1 GW in August 2017 providing electricity for an equivalent of 10.7 million homes per annum. Hence, there is a huge potential to power tens of millions of homes in Sub-Saharan Africa using wind power.
High potential countries in Sub-Saharan Africa are primarily on the south and east coasts and along the Rift Valley, where wind speeds reach over 9 m/s in South Africa and Somalia, and over 8.5m/s in Kenya. The percentage of land covered by wind energy generators in these countries is expected to be 0.9% which is the same percentage in Denmark and Germany.
9.1.2 Structure of a wind turbine Wind turbines are used to capture energy from wind and convert it to useful electrical energy. The most common design of wind turbines is the horizontal axis wind turbine (HAWT) where the main rotor axis is parallel to ground.
- Watch this video and then place the names of the different components of a HAWT on the diagram in Fig.9.1. 📹
- Click here for the answers 📷
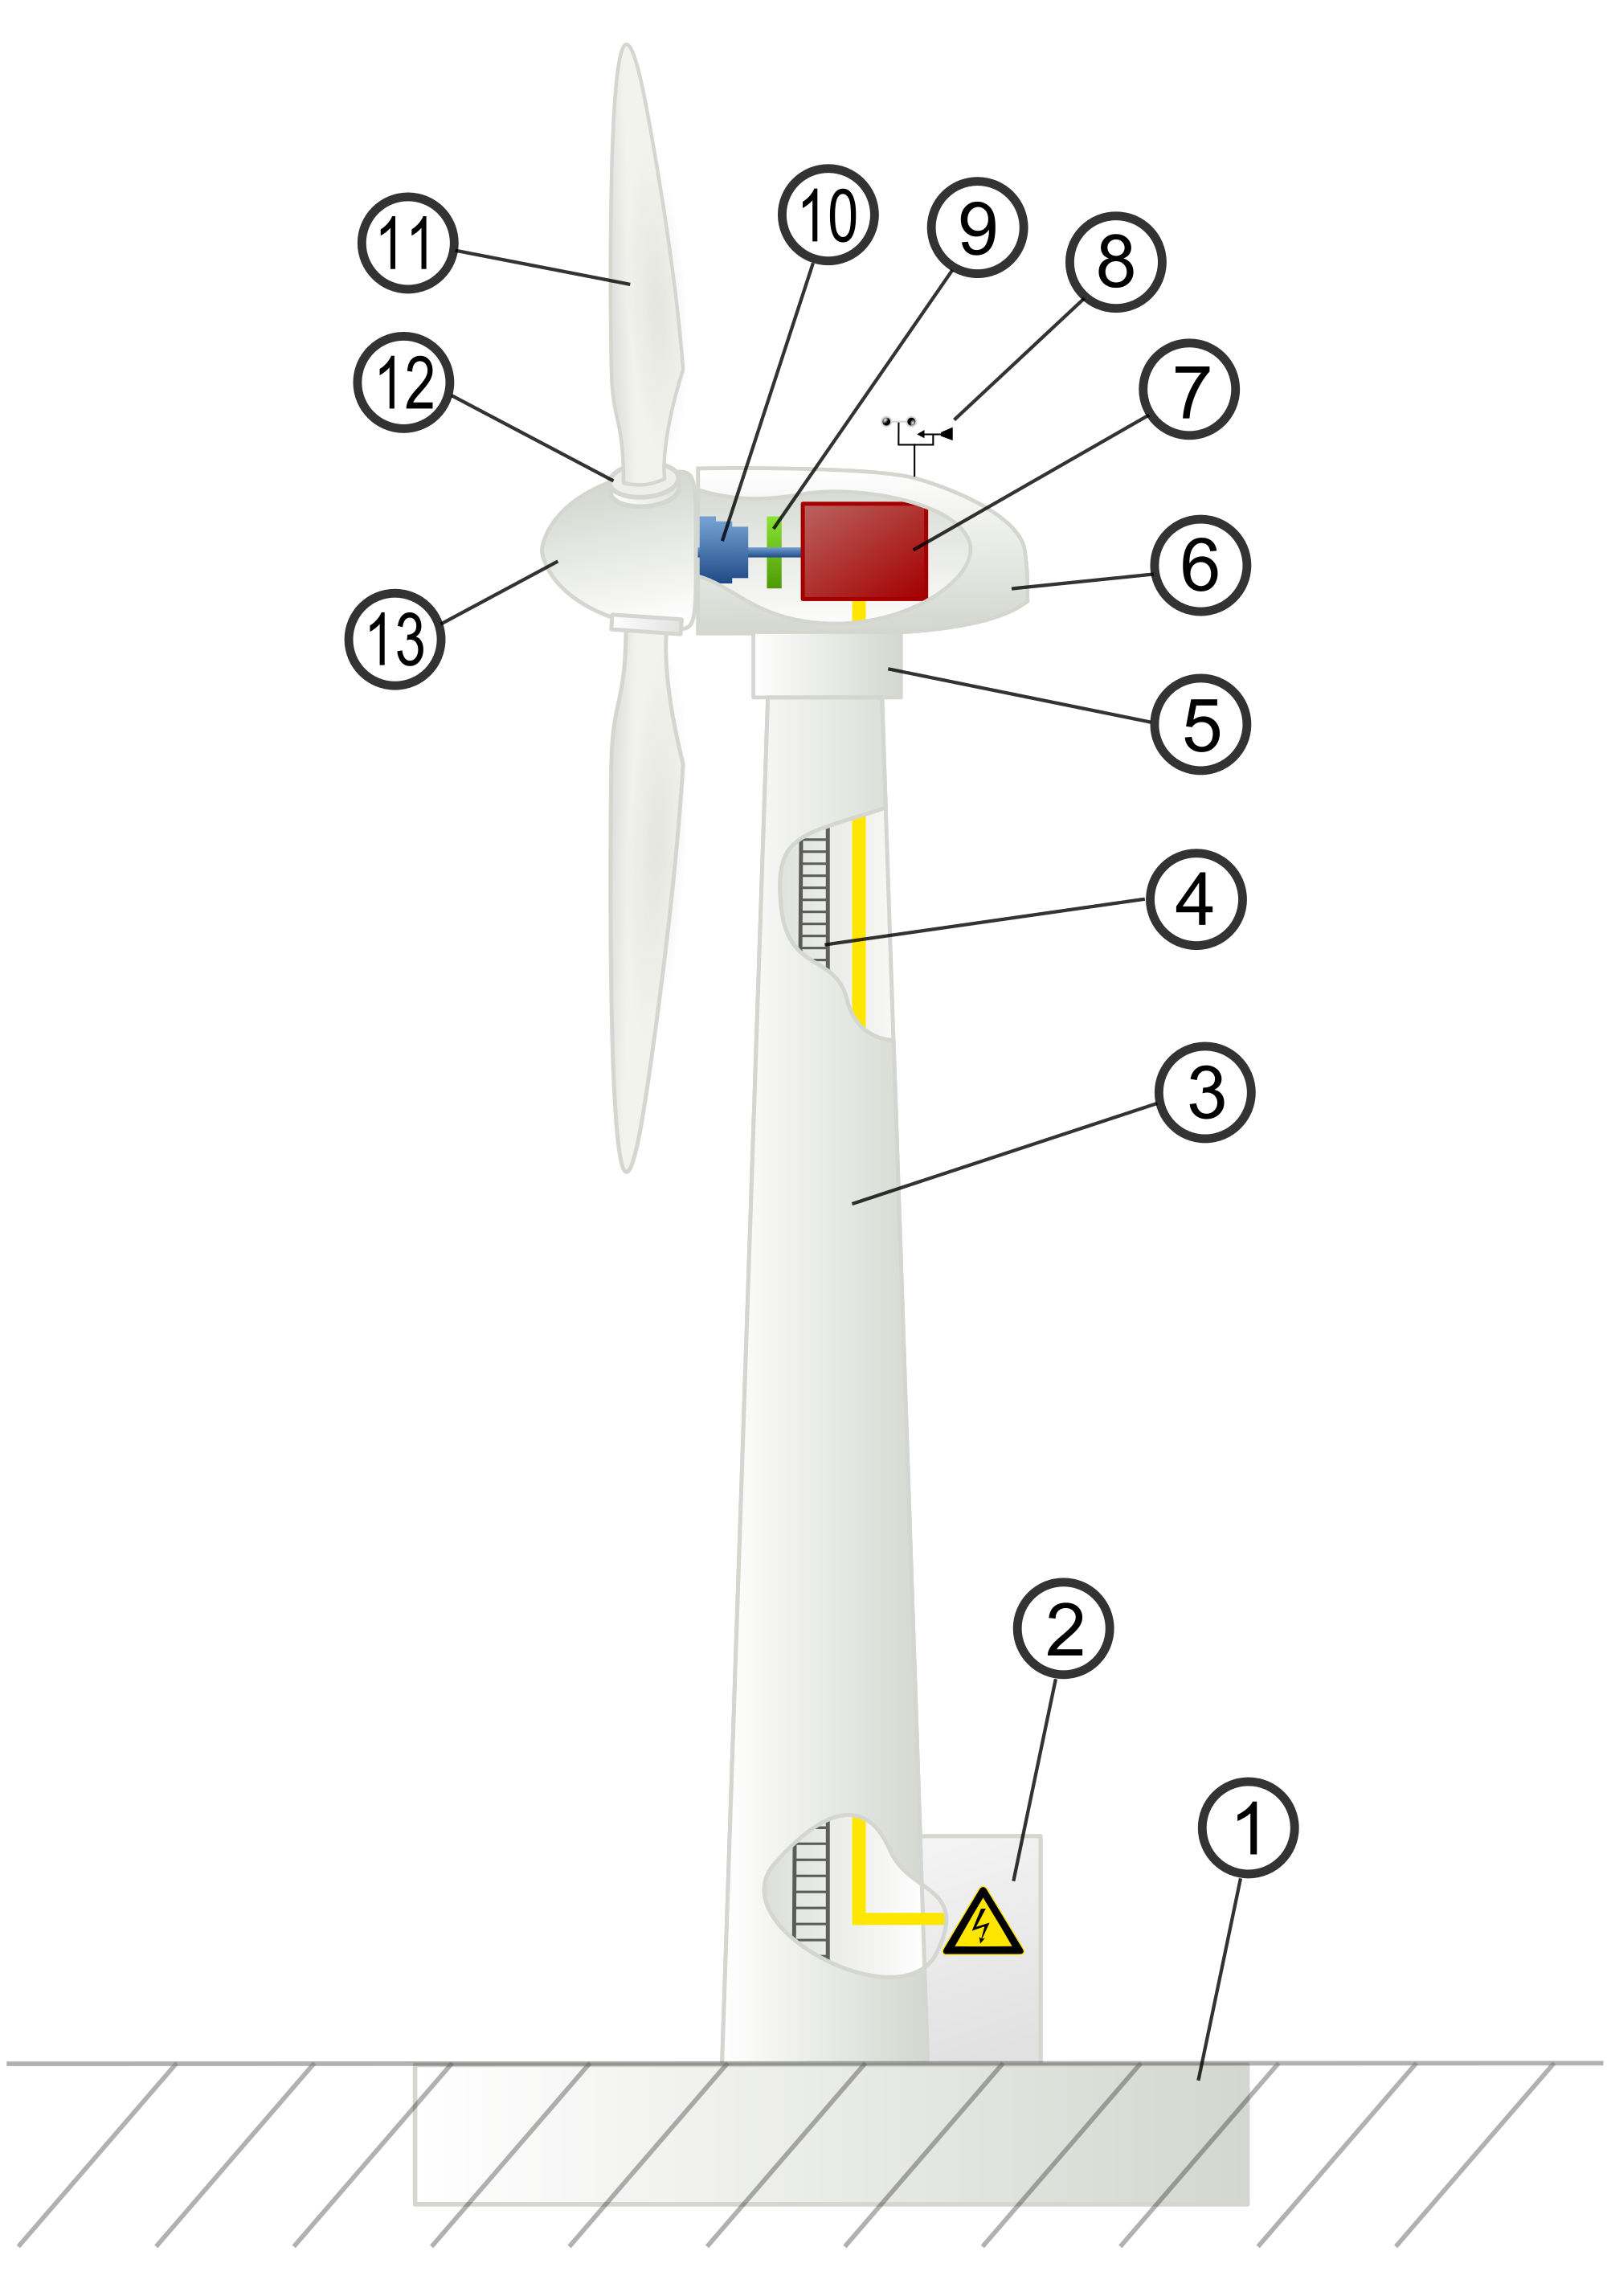
Fig.9.1 Horizontal Axis Wind Turbine
( source: https://commons.wikimedia.org/wiki/File:Wind_turbine_int.svg)
9.1.3 Power from the wind
(a) Electrical power equation
The kinetic energy Ew of the wind can be expressed as
E_w=\frac{1}{2}mv^2 (9.1)
where m and v are the mass (kg) and velocity (m/s) of the air respectively. Considering the area A swept by the rotor blades as the window in which the air flows into the turbine, it can be shown that the power in the wind Pw is
P_w=\frac{1}{2}(\rho A\nu )v^2=\frac{1}{2}\rho A\nu ^3 (9.2)
where ρ is the density of air (1.201 kg/m3 at 20°C). Hence this presents the theoretical maximum power that can be extracted from wind. However, in practice, it is not possible to extract all of this power from the wind, and it has been shown that the maximum wind to mechanical energy conversion efficiency is 59.3%. This number is known as the Betz limit. This is the ideal maximum power that can be extracted from wind. In modern wind turbines, a practical range of values for this conversion efficiency is typically 30-45% and is known as the power coefficient Cp
P_w(max)=\frac{1}{2}C_p\rho A\nu ^3 (9.3)
In addition to the wind to mechanical energy conversion efficiency, the efficiency of the gearbox and the electric generator must be taken into account.
(b) Numerical example
A wind turbine has three rotor blades each of length 60m operates with a power coefficient of 0.4 at a wind speed of 8 m/s. Assume that the gearbox efficiency is 87% and the generator efficiency is 85%, calculate the electrical power generated by the turbine. Take the density of air as 1.201 kg/m3.
Solution: (to be made invisible and students attempt first) Area swept by turbine
A=\pi \times60^2=11309.73m^2
Electrical power Pe can be calculated using
P_e=0.87 \times 0.85 \times\frac{1}{2}C_p\rho A\nu^3
= P_e=0.87 \times 0.85 \times0.5\times0.4\times1.201\times\11309.73\times8^3
= 1.03MW
(c) Wind speed/power characteristics
The power produced by a wind turbine Pw can be seen from equation (9.3) to be proportional to the cube of the wind speed v. However, Cp is not ideally constant and tends to vary with wind speed. In fact several factors affect the value of Cp such as the number of blades, blade shape, the speed of rotation and the aerodynamic efficiency. For this reason, every wind turbine will have a unique wind speed/power characteristics curve such as this in Fig.9.2
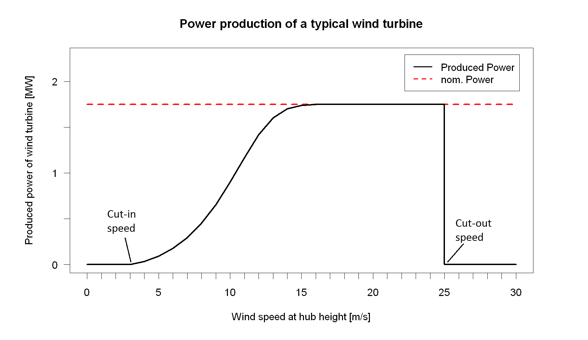
Fig. 9.2 Typical wind speed/power curve for a 1.7MW generator
[source: https://commons.wikimedia.org/wiki/File:Powercurve.png]
Below cut-in speed (3m/s) there is no output and over cut-out speed (25m/s) wind turbine is stalled as wind speeds are too excessive and can cause structural damage to the turbine. Fig. 9.2 shows the actual wind speed/power curves for a typical 1.7 MW wind turbine where rated output is reached at speeds starting from 15m/s. The wind blades are controlled in the wind speed range 15 < v < 25m/s to maintain generator output capped at rated value.
(d) Wind farm capacity factors
The theoretical maximum energy output of a wind farm per year can be calculated; given the number of hours in a year is 8760h, by
Wind farm rating [MW] x 8760 (9.4)
However, the actual energy output is much less as the generators will not be operating at maximum rating all year round at all times. This depends on the wind speed frequency distribution at the wind farm location which in turn affects the power output. Therefore, it is clear that detailed information on the availability of useful wind speeds throughout the year is crucial to the siting of the wind farm. Sites where the wind speed averages 4.5m/s or more are likely to be suitable.
The fraction of the maximum theoretical annual energy output that is actually generated is called the capacity factor
capacity factor=\frac{actual output[MWh]}{rating[MW]\times8760} (9.5)
Well sited wind farms have a capacity factor of about 0.3-0.35. In Sub-Saharan Africa, countries with high potential of wind energy that can achieve such wind farm capacity factor lie on the east and south coast such as Somalia, Kenya and South Africa.
(e) Quiz - Send your answers to the Tutor.
1- What is meant by wind turbine cut-in speed?
2- What is cut-out speed?
3- Some studies have shown that a potential wind farm location is expected to have a 15% capacity factor. Comment on the suitability of this location.
9.1.4 Advantages and disadvantages of wind generation
Advantages of wind energy generation include:
• No carbon dioxide emissions
• No radioactivity or nuclear waste storage
• ?
Disadvantages:
• Visual impact. This could be due to size of a wind farm, the colour, the blade design and the number of wind turbines in a farm.
• Noise pollution. Modern designs take this factor into account to reduce the associated acoustic disturbance.
• Possible impact on birds and wildlife in sensitive habitats
• ?
Question: What do you think could minimize visual and acoustic impacts of wind farms? Answer: Offshore wind farms
9.1.5 Offshore wind
It is obvious that wind speeds are higher and steadier offshore compared to onshore based sites.
Question: So why don’t utility companies and grid operators decide to build all wind farms in offshore locations?
Send your answer to the Tutor.
- Answer: 📷
- Today, offshore wind is gaining increasing importance due to its high wind potential and UK is world leading in this sector since October 2008, with more installed capacity than any other country. In fact, the UK generates more electricity from offshore wind than any other country and the sector meets around 5% of annual demand in 2017 and this is expected to grow to 10% by 2020.
Typical offshore turbine cut-out speed is 30m/s compared to a typical 25 m/s for onshore sites. With the cubic velocity relation, electrical power generated can be considerably higher offshore.
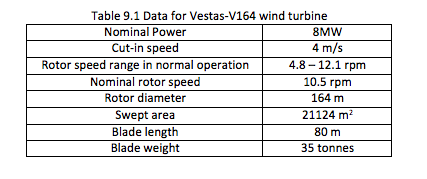
Currently, the world’s largest wind turbine is the Vestas-V164 with 8-9 MW of installed nameplate capacity and is for offshore use. Table 9.1 shows the main data for this turbine.
9.1.6 Wind power grid integration The output of wind generation is intermittent, while grid connection needs voltage and frequency to be well regulated. Energy storage is used to provide back up for periods of low generation. One attractive method to store electricity is by using pumped storage hydroelectricity capacity. Other storage methods are currently unproven at large scale.
Also, the larger the geographical area of the grid interconnection, the less vulnerable overall is the grid to a localized loss of wind power as wind is likely to be available at different locations at different times, hence evening out power supply profile.
9.1.7 Questions for further study/research on wind energy (Send your answers to the Tutor) 1- What are the main differences between vertical axis and horizontal axis wind turbines?
2- What is meant by direct drive wind turbines?
3- Name a few worldwide wind turbine manufacturers and their countries of origin.
Answer:
1- Foundation
2- Connection to power grid
3- Tower
4- Service ladder
5- Yaw system (for wind direction tracking)
6- Nacelle
7- Generator
8- Anemometer (to measure wind speed)
9- Brake
10- Gearbox
11- Rotor blade
12- Pitch control system
13 - Rotor hub
Answer:
• Capital cost of construction and integration into network with submarine cables
• Operation and maintenance are higher since access is more difficult
• Impact on fishing and navigation
-
- 9.2 Solar Energy
- 9.2.1 Introduction
Solar energy is radiant light and heat from the sun, which can be used via a range of technologies such as solar heating, solar photovoltaics, solar thermal electricity, solar architecture and artificial photosynthesis.
Solar energy is a seriously underrated resource. The Earth receives 174 Petawatt (1.74 x10¹⁷ W) of incoming solar radiation at the upper atmosphere. This is more power hitting the Earth in a single hour than humanity uses in an entire year. Approximately 30% is reflected back to space while the rest is absorbed by atmosphere, clouds, oceans and land.
According to the “Brighter Africa” report by McKinsey&Company in 2015, solar energy has the most abundant potential for power production in Sub-Saharan Africa. Excluding solar, it is estimated that Sub-Saharan Africa has potential of installing 1.2 TW of power capacity, which in the existence of solar was estimated to reach a staggering 12 TW! The solar potential is dominated by the large and desert countries, with the top five—Chad, Democratic Republic of Congo, Mali, Niger, and Sudan—holding about 40 percent of the potential capacity.
One possible solar project that once received considerable attention is the 100 GW-capacity Desertec in North Africa, which was targeting creation of an energy market that could export clean energy north to Europe, and south to Western Africa. However, several European countries have withdrawn funding to this project which has led to its eventual freeze.
The main problem with solar is that it is often still more expensive than fossil fuels or hydro sources due to its high capital cost, and adding to this the cost of storage to provide night time supply makes it yet more expensive and hence less competitive compared to other sources of energy.
Since solar energy can be used to generate thermal energy or electrical energy, we will focus in our study here on the production on electrical energy using the two main technologies:
1- Concentrated solar power (CSP); and
2- Photovoltaics (PVs).
9.2.2 Concentrated solar power (CSP)
Concentrated solar power (CSP) systems use lenses or mirrors and tracking systems to focus a large area of sunlight into a small beam. The concentrated heat is then used as a heat source for a conventional power plant.
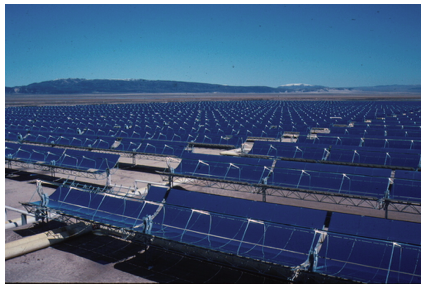
Fig. 9.3 CSP power station in California, USA, 1984, 354 MW
[source: https://sco.wikipedia.org/wiki/File:Solar_Plant_kl.jpg]
The Ouarzazate solar power station in Morocco, also called Noor power station, uses CSP technology with heated molten salt to store solar energy to produce electricity overnight. The power station has been commissioned and operational since February 2016 with a nameplate capacity of 160MW which is planned to increase to 580MW at peak when all project phases are over.
(a) CSP technologies A wide range of concentrating technologies exists; the most developed are the parabolic trough, the concentrating linear Fresnel reflector, the Stirling dish and the solar power tower. Fig 9.4 shows how some of these technologies operate.
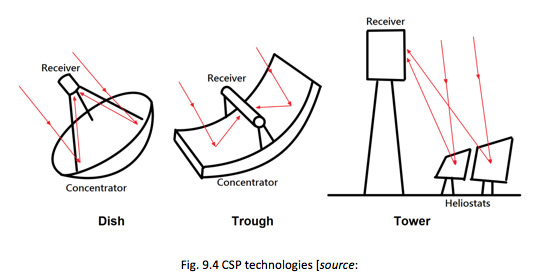
https://commons.wikimedia.org/wiki/File:Type_of_Concentrated_solar_power.png
Various techniques are used to track the Sun and focus light. In all of these systems a working fluid is heated by the concentrated sunlight, and is then used for power generation or energy storage.
(b) Parabolic Trough CSP
The parabolic trough is the most mature of the CSP technologies with good operating experience. A trough based plant operates in the following sequence:
• Parabolic mirror reflects solar energy onto a receiver
• Heat transfer fluid such as oil or water is circulated through pipe loop
• Collectors track sun from east to west during day
• Thermal energy transferred from pipe loop to heat exchangers, where water is preheated, evaporated and then superheated
• The superheated steam runs a turbine, which drives a generator to produce electricity.
Advantages:
• Low cost
• Tracking system is simple (one-axis) due to the using of line focus collector
• Commercially available
• Hybrid (solar/fossil) operation
Disadvantages:
• Low temperature
• Large land occupancy
Low efficiency (peak 14-20 %, Annual 11-16 %)
(c) Assignment Having read about how the parabolic trough technology works, now look back at Fig. 4.
Can you state some differences between the parabolic trough method and the dish and tower methods?
Send your answer to the Tutor.
- Answer 📷
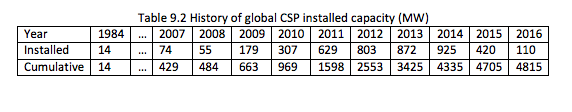
- (d) Status of global installed CSP
CSP growth is expected to continue at a fast pace. As of January 2014, Spain had a total capacity of 2,204 MW making this country the world leader in CSP. Interest is also notable in North Africa and the Middle East, as well as India and China. The global market has been dominated by parabolic-trough plants, which account for 90% of CSP plants.
Spain and the United States remain the global leaders, while the number of countries with installed CSP is growing. There is a notable trend towards developing countries and regions with high solar radiation. Global installed CSP capacity has increased nearly tenfold since 2004 and grew at an average of 50% per year during the last five years. Table 9.2 shows the history of global CSP installed capacity.
9.2.3 Photovoltaics (PVs)
A photovoltaic (PV) cell, is a device that converts light into electric current using the photoelectric effect. When a photon of light is absorbed by the PV material, usually silicon, its energy is given to an electron exciting it into the conduction band allowing it to move freely around within the semiconductor. The bond which the electron has just left has one less electron and is termed a ‘hole’. Thus, the photons absorbed in the semiconductor create mobile electron-hole pairs, which is essentially electric current created by the internal electric field at the p-n junction when a closed circuit exists. This current is therefore DC and is directly proportional to the intensity of incident light, and the cell area.
(a) Types and conversion efficiencies of solar cells
There are 2 major types of solar cells according to the semiconductor used:
1- Silicon semiconductor
2- Compound semiconductor
Organic semiconductor is under development for further cost reduction. Fig. 9.5 illustrates the various types of PV solar cells and their typical conversion efficiencies.
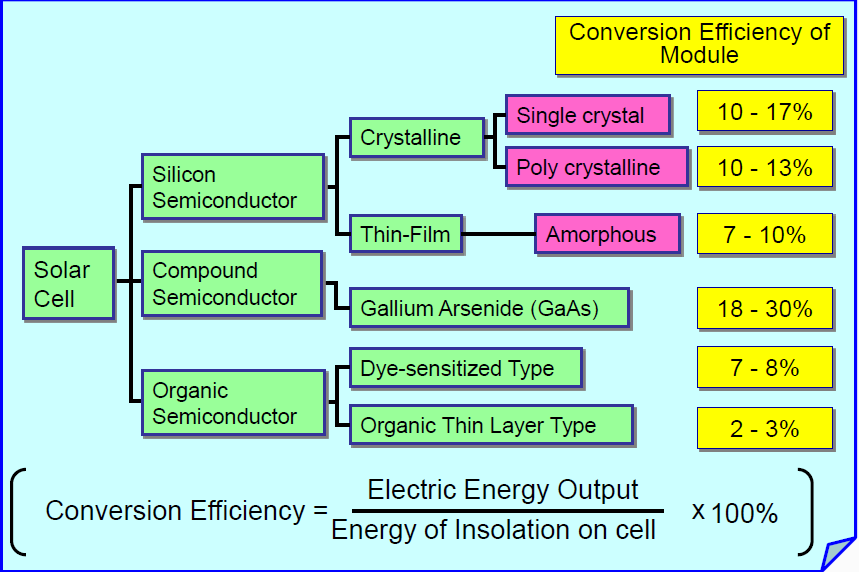
Fig. 9.5 Types of PV solar cells and their conversion efficiencies
[source: From free-to-download slides on http://slideplayer.com/slide/2516449/]
Solar cell using silicon semiconductor is further divided into crystalline and non-crystalline or amorphous semiconductor. The crystalline type silicon semiconductor is widely used for its high conversion rate and reliability track record. Single-crystal silicon is formed by melting high purity silicon, then sliced very thinly and processed into solar panel. Polycrystalline silicon reduces the cost of solar panels, by using metal silicon pure enough to manufacture solar cell. This is poured into a mold and crystallized. The amorphous type semiconductor performs well even under a fluorescent lamp, so, it is used as a source of power for calculators and wrist watches. Compound semiconductor’s conversion efficiency is very high, but it is more expensive and difficult to obtain.
(b) Cell to module to array
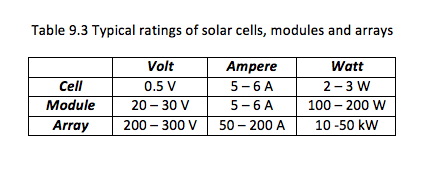
Since an individual silicon cell produces only about 0.5 V, it is rare to find an application using a single cell. Instead, the basic building block for PV applications is a module consisting of a number of cells in series and/or parallel. A typical module has 36 cells in series and is often designated as a 12-V module even though it is capable of delivering much higher voltages than that. Large 72 cell modules are now quite common, some of which have all of the cells wired in series, in which case they are referred to as 24-V modules. Arrays are made up of multiple modules to suit a particular application. Fig. 9.6 shows typical schematic of solar cells, modules and arrays and Table 9.3 summarizes typical ratings for each.
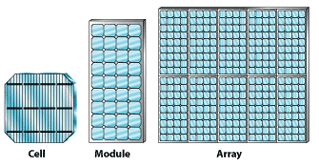
Fig. 9.6 Solar cell to module to array [source: https://commons.wikimedia.org/wiki/File:Pv_cells.png]
(c) Test your knowledge
Mark the following statements as TRUE or FALSE and correct false statements.
1- PV cells convert sun heat into electric current. ( )
2- The current generated by a solar cell can be alternating current depending on the type of solar cell. ( )
3- Compound semiconductor solar cells are more efficient than silicon solar cells. ( )
4- Gallium Arsenide solar cells are less expensive than polycrystalline solar cells. ( )
5- Thin film type semiconductor performs well even under a fluorescent lamp. ( )
6- It is more likely to use a solar array to charge a 12-V 150-W battery system than to use a solar module. ( )
- Answer 📷
- (d) Solar radiation, cell efficiency and annual output
Annual solar radiation on a horizontal surface at the equator is over 2000 kWh/m2. In northern Europe this falls to 1000 kWh/m2 per annum. With a typical polycrystalline solar cell efficiency of 12%, this means that the theoretical maximum energy output in northern Europe per m2 per annum is 120 kWh. UK installers currently count on an output of only about 90 kWh per m2 per annum. This means that a typical annual household consumption of 1000 kWh of essential non-heating electricity (i.e. lighting, radio, TV, PCs, appliances…etc) would require 10 – 12 m2 of solar array.
However, much of this output is during the summer months and only in daytime. This can be mitigated by the exchange of power with the grid or by use of battery storage for demand after sunset.
Example: A PV module has a working area of 1.651m x 1m and has a conversion efficiency of 12%. It receives a total solar radiation of 1000 kWh/m2 per annum. It is required to use this PV module to provide essential electricity domestic needs of 1200 kWh per year. How many of these PV modules are necessary?
Solution: Working area= 1.651 x 1 =1.651 m2 Actual energy output from PV module= 1000 x 1.651 x 0.12 =198.12 kWh per annum Number of PV modules required= 1200/198.12 ≈ 6 modules
(e) Status of global installed PV
According to the European Photovoltaic Industry Association (EPIA) ‘Global market outlook for solar power 2017-2021’ report, the following can be summarised:
• 2016 was a record year for solar. A total of 76.6 GW was installed and connected to the grid in 2016 representing a 50% increase over the 51.2 GW installed in 2015.
• The total installed solar PV power capacity increased 33% to 306.5 GW by the end of 2016, up from 229.9 GW in 2015.
• The global solar market in 2016 was even more dominated by one country than it was the year before – China, which connected 34.5 GW to the grid, a 128% increase over the 15.1 GW it added the year before. The 2016 PV installations were equal to a global market share of 45%.
• 2016 was a disappointing year for solar in Europe. With only 6.7 GW of newly installed PV capacity, the European solar power market shrank by 22% year-on-year.
• The European solar pioneers, which still owned the major global portion in 2015, are now ranked second – with a cumulative PV capacity of 104.3 GW and a 34% share.
(f) Grid connected solar PV
PV systems can be designed to provide DC and/or AC power and can be connected with other energy sources or energy storage systems. Solar PV systems can therefore be ‘stand-alone’ or ‘grid-connected’. Fig. 9.7 shows a typical grid-connected PV system.
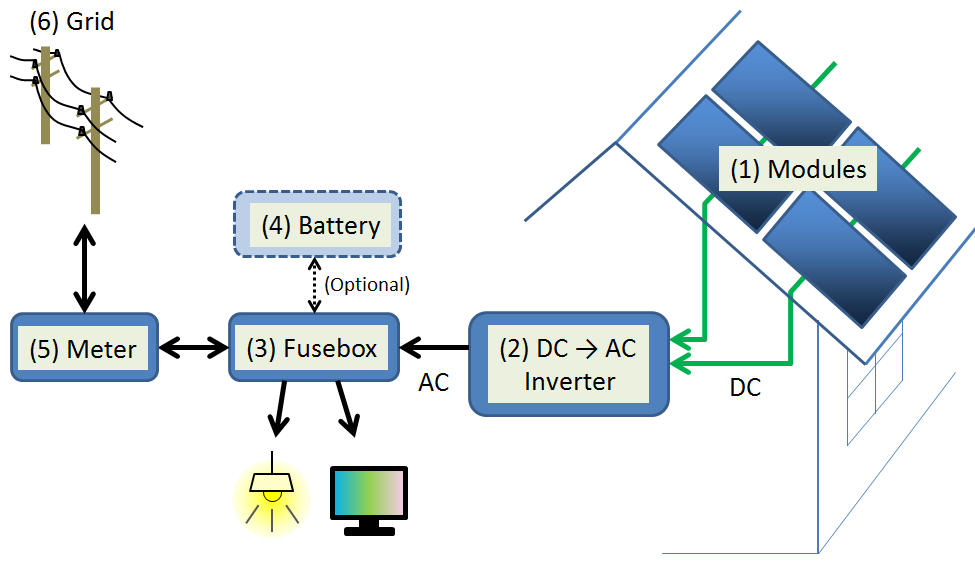
Fig. 9.7 Grid-connected PV system [source: https://upload.wikimedia.org/wikipedia/commons/2/20/PV-system-schematics-residential-Eng.png]
The inverter converts DC from the solar panels to AC for use at home and connection to the AC grid.
The battery is used to store energy produced from the solar panels for use at night time or emergency. For grid-connected systems it may be optional, as loads can be fed from the grid during times when the solar panels are operational. They become critically important in stand-alone systems which have no other source of power. A charge controller is used to prevent batteries from overcharging.
The meter measures electricity use and production, and monitors bi-directional flow of power to and from the grid. Users can export excess electricity to the grid and use this to reduce their bills or receive money using what is called feed-in tariff (FIT).
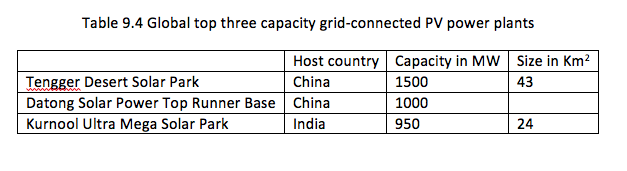
In addition to small domestic grid-connected installations, there are a number of large PV installations specifically built to supply power to the grid. These are multi-megawatt PV power plants and as it stands in 2017, China and India host the top three capacity PV power stations in the world. Table 9.4 shows details of these grid-connected PV power plants.
(g) Environmental considerations
Solar PV generation has little environmental impact.
• No pollutants and no radioactive waste
• Visual impact can be minimized by using land that is otherwise unused or floating structures offshore.
• Manufacture of silicon PV cells also has little environmental impact- Answer:
• In dish and tower technologies, tracking system needs to be two-axis since they use point focus collector, compared to line focus collectors in parabolic trough. This makes tracking system more complicated.
• Point focus means higher temperatures can be achieved, hence higher system efficiencies.
• ?- Answer:
1- FALSE. Sun light.
2- FALSE. Only DC.
3- TRUE.
4- FALSE. More expensive.
5- TRUE.
6- FALSE. Solar module more likely -
-
-
![[source: https://sco.wikipedia.org/wiki/File:Solar_Plant_kl.jpg]](https://sco.wikipedia.org/wiki/File:Solar_Plant_kl.jpg)