Wk 7
-
- Normally engineering systems do not contain single compression members (struts or columns) on their own, but are usually an assembly of differently loaded components.
Because of the apparent weakness to compressive loading, these components require special attention in their analysis to avoid failure which occurs at load levels and stress levels much less than the strength of the materials being used.
Now please view the below video
- Derivation of Buckling Load Video
- After watching the above video, move on to tab 7.1

Euler Buckling Theory
- Failure of Components in Compression: Introduction
- Figure 1
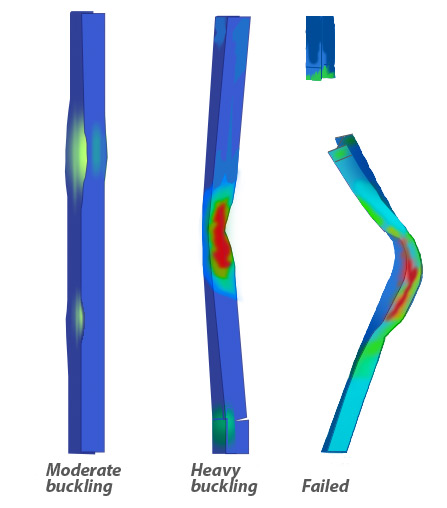
- Buckling occurs in the compression test due to out-of-plane-bending, instead of the material fracture experienced in the tension test.
 📷 Figure 2 - Larger Tension Test Diagram
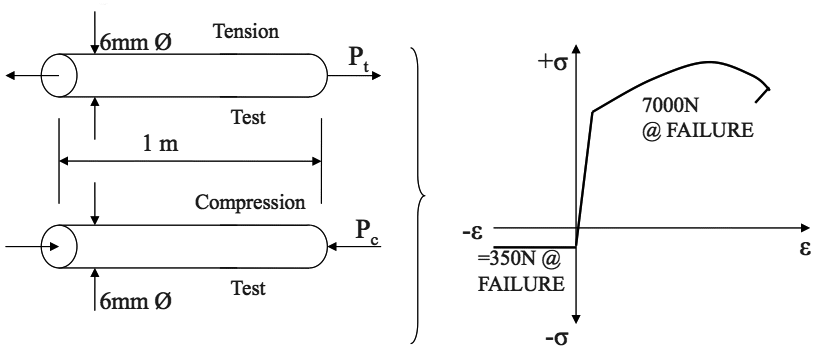
- Normally engineering systems do not contain single compression members (struts or columns) on their own, but are usually an assembly of differently loaded components.
-
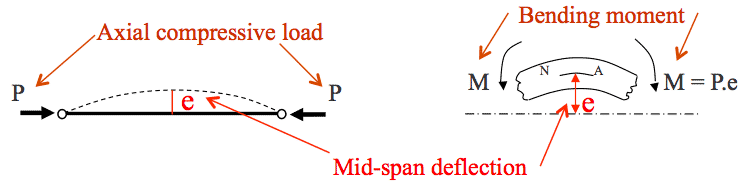
Pin-Ended Column Subject to Pure Axial Compression (cont.)
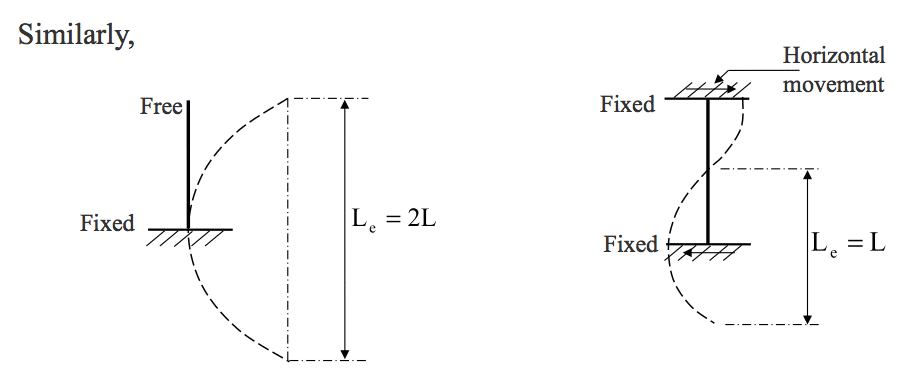
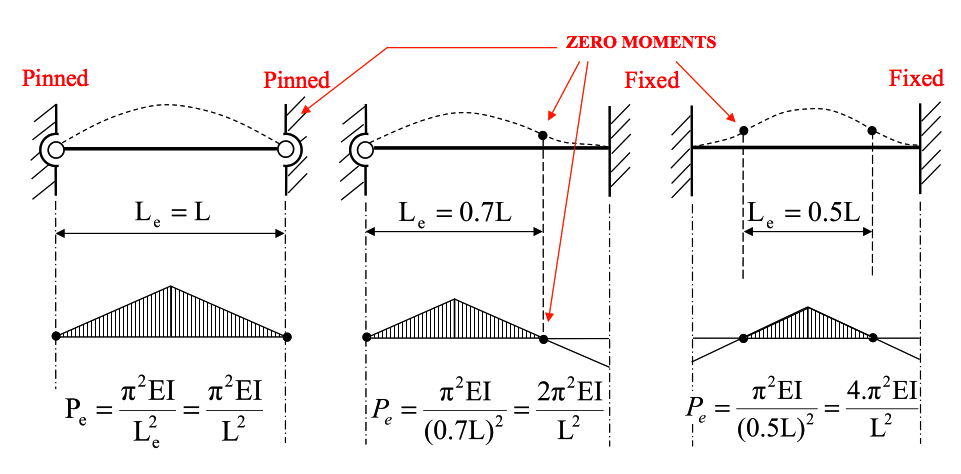
- Derivation of Buckling Load (cont.) – Equivalent length Le (as seen in the video on the introduction tab)
- 📷 Larger Diagram
 Leonhard Euler: 15 April 1707 (Basel)
to 18 September 1783 (Petersburg)Hence, the Euler buckling load equation is: $ \Large P_e = \frac{\pi^2 EI}{L^2_e} (N) \; \; \small Eqn \; (1) $
*Note: The physical basis for Euler theory includes 3 main assumptions:
- Strut initially straight - Load purely axial - Homogenous material - Derivation of Buckling Load (cont.) – Equivalent length Le (as seen in the video on the introduction tab)
- (Cont.)
$$ \large P _e = \frac{\pi ^2 EI}{L ^2 _e} $$$$ \large \sigma _e = \frac{\pi ^2 E}{\lambda ^2} $$
Failure will occur about the axis X-X or Y-Y which produces the largest (critical) slenderness ratio, ( = Le/r). (Normally the axis with the least value of I!).
This critical axis is then used for design calculations.
A load factor is used in Buckling analysis, where $$ \text{Load Factor} = \frac{\text{BucklingLoad}}{\text{WorkingLoad}} $$Buckling: BS5950 Design Approach
- Practical Struts
The previous graph (seen opposite) of $ \sigma _e \; vs. \large \lambda $ indicates that the Euler theory is not valid/accurate for‘ $ \large \lambda $ tending to 0’. It is a very theoretical approach! This is obviously a cause for concern for Design Engineers, when a theory over-predicts a loading capacity as this would lead to unsuitable and unsafe load factors or factors of safety.
- ⬇ Download worked example
Pin-Ended Column Subject to Pure Axial Compression (cont.)
- Euler Buckling Stress:
$$ \large \sigma _e = \frac{P}{A} = \frac{\pi ^2 EI}{L_e ^2 A} = \frac{\pi ^2 EAr^2}{L_e ^2 A} = \frac{\pi ^2 E}{\Bigg( \frac{\LARGE L_e}{r} \Bigg) ^2} $$ where $ \large \sqrt{ \frac{ I}{A}} = $ radius of gyration, and $ \large \frac{\LARGE L_e}{r} = $ slenderness ratio $ \large \lambda $
$$ \large \sigma _e = \frac{\pi ^2 E}{\lambda ^2} $$
Graph of Euler Stress v. Slenderness Ratio
- 📷 Larger Euler Theory Graph
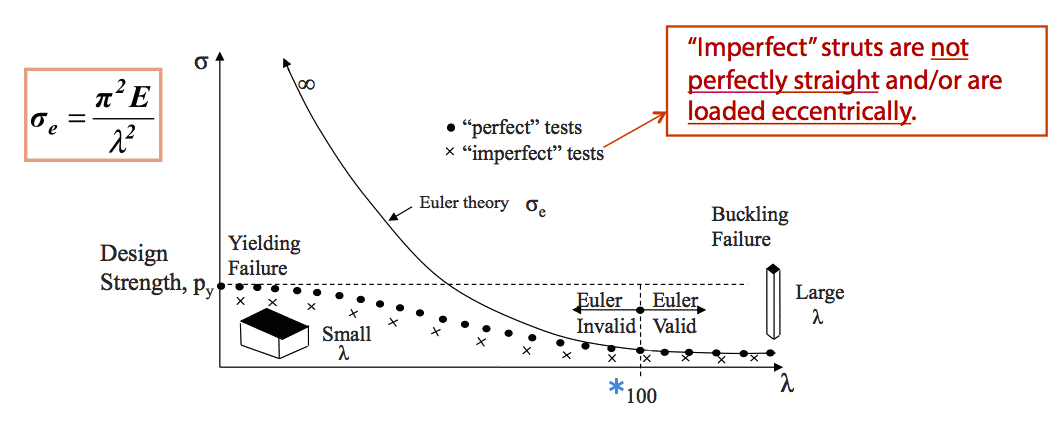
- *Notes:
The graph above shows that Euler theory is only valid where the slenderness ratio, $ \large \lambda $ is > 100 !!
The critical value of $ \large \lambda $ can vary for depending on material, boundary conditions and application, and also on the researcher – some engineers, mainly civil, use $ \large \lambda $ = 80; some, mainly structural, use $ \large \lambda $ = 120!
- (Cont.)
-
-
Tutorials
- ⬇ Euler Buckling Tutorial